Global and China Biodegradable Plastics Industry Report, 2014-2018
-
Sep.2015
- Hard Copy
- USD
$2,500
-
- Pages:95
- Single User License
(PDF Unprintable)
- USD
$2,300
-
- Code:
HK061
- Enterprise-wide License
(PDF Printable & Editable)
- USD
$3,500
-
- Hard Copy + Single User License
- USD
$2,700
-
Biodegradable plastics are polymer materials which are quickly degradable through microbial life activities in natural environments or under conditions of composting. Currently, more than 70% of global biodegradable plastics are used in the packaging industry.
In recent years, with the continued promotion of the low-carbon economy, the global biodegradable plastics output has maintained a high growth rate, attaining about 668 kilotons in 2014. All over the world, only plastarch material (PSM), polylactic acid (PLA), polybutylene succinate (PBS), etc. have realized industrial production. In 2014, PSM, PLA and PBS accounted for 41%, 24% and 21% of the world's total output, respectively.
Global demand for biodegradable plastics is mainly concentrated in Europe and North America, and their demand accounted for approximately 70% in 2014 together. However, in recent years, the Asian market has generated fast-growing demand, which is expected to represent 32.3% in 2018.
Global biodegradable plastics enterprises are mainly from Europe, America and Japan, such as Europe-based BASF, Novamont and Corbion, America-based NatureWorks and Metabolix, Japan-based Mitsubishi Chemical and Showa Denko. By capacity, BASF and NatureWorks top the list with respective capacities of 140 kt/a PBS and 140 kt/a PLA.
At present, Chinese biodegradable plastics market witnesses oversupply, most manufacturers rely on exports, and the domestic demand stays at a low level. However, as the government pays more attention to energy waste and environmental protection, biodegradable plastics industry policies are expected to be launched soon, thus stimulating China’s demand for biodegradable plastics swiftly. In 2014, China’s biodegradable plastics capacity reached around 380 kilotons, mainly serving packaging film, agricultural film, household plastics and other fields.
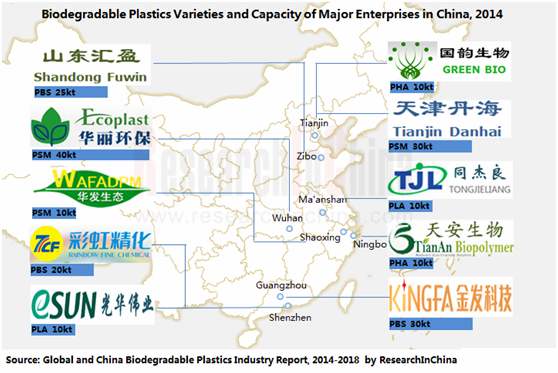
In 2014, Chinese biodegradable plastics manufacturers included Wuhan Huali Environment Technology, Kingfa Sci & Tech, Tianjin Danhai, Shandong Fuwin, Shenzhen Rainbow Fine Chemical Industry, etc. The capacity of these five companies accounted for about 40% of the national total capacity.
Now, China intends to build numerous biodegradable plastics projects, including a 90 kt/a PBSA Phase II expansion project of Kingfa Sci & Tech, a 20 kt/a biodegradable plastics PBS project Phase II of Yifan Xinfu Pharmaceutical, a 60 kt/a low-carbon biodegradable materials and products project of Shenzhen Rainbow Fine Chemical Industry, a 60 kt/ a bio-plastics R & D production base project of Wuhan Huali Environment Technology.
The report mainly covers the followings:
 Supply and demand, product mix, regional structure, competition pattern, development trends of global biodegradable plastics market;
Supply and demand, competition pattern, development trends of Chinese biodegradable plastics market;
Development status and competition pattern of biodegradable plastic product segments such as PSM, PLA, PHA, PBS;
Operation, biodegradable plastics business, prospects, etc. of 25 domestic and foreign biodegradable plastics manufacturers.
1. Overview of Biodegradable Plastics Industry
1.1 Definition
1.2 Classification
1.3 Industry Chain
2. Global Biodegradable Plastics Market
2.1 Supply and Demand
2.2 Product Mix
2.3 Regional Structure
2.3.1 USA
2.3.2 Europe
2.3.3 Japan
2.3.4 Brazil
2.3.5 Thailand
2.4 Technology Trends
2.5 Competition Pattern
2.6 Development Trends
3. China Biodegradable Plastics Market
3.1 Market Supply
3.2 Market Demand
3.3 Competition Pattern
3.4 Policy Trends
3.5 Development Trends
4. Biodegradable Plastics Market Segments
4.1 Plastarch Material (PSM)
4.1.1 Development Status
4.1.2 Competition Pattern
4.2 Polylactic Acid (PLA)
4.2.1 Introduction
4.2.2 Competition Pattern
4.3 Polyhydroxyalkanoates (PHA)
4.3.1 Development Status
4.3.2 Competition Pattern
4.4 Polybutylene Succinate (PBS)
4.4.1 Introduction
4.4.2 Competition Pattern
4.5 Others
4.5.1 Polycaprolactone (PCL)
4.5.2 Polypropylene Carbonate (PPC)
4.5.3 Aliphatic-Aromatic Copolyester
4.5.4 Polyvinyl Alcohol (PVA)
5. Main Foreign Players
5.1 BASF
5.1.1 Profile
5.1.2 Operation
5.1.3 Operation of Functional Materials & Solutions Division
5.1.4 Biodegradable Plastics Business
5.1.5 Business in China
5.2 NatureWorks
5.2.1 Profile
5.2.2 Business in China
5.3 Novamont
5.3.1 Profile
5.4 DuPont
5.4.1 Profile
5.4.2 Operation
5.4.3 Biodegradable Materials Business
5.4.4 Business in China
5.5 Mitsubishi Chemical
5.5.1 Profile
5.5.2 Operation
5.5.3 Biodegradable Plastics Business
5.5.4 Business in China
5.6 Showa Denko
5.6.1 Profile
5.6.2 Operation
5.6.3 Biodegradable Plastics Business
5.7 Corbion
5.7.1 Profile
5.7.2 Operation
5.7.3 Biodegradable Plastics Business
6. Main Chinese Players
6.1 Kingfa Sci & Tech
6.1.1 Profile
6.1.2 Operation
6.1.3 Revenue Structure
6.1.4 Gross Margin
6.1.5 R & D
6.1.6 Biodegradable Plastics Business
6.1.7 Development and Forecast
6.2 Yifan Xinfu Pharmaceutical
6.2.1 Profile
6.2.2 Operation
6.2.3 Revenue Structure
6.2.4 Gross Margin
6.2.5 R & D
6.2.6 Biodegradable Plastics Business
6.2.7 Development and Forecast
6.3 Shenzhen Rainbow Fine Chemical Industry
6.3.1 Profile
6.3.2 Operation
6.3.3 Revenue Structure
6.3.4 Gross Margin
6.3.5 R & D
6.3.6 Biodegradable Plastics Business
6.3.7 Development and Forecast
6.4 Wuhan Huali Environment Technology
6.4.1 Profile
6.4.2 Biodegradable Plastics Business
6.5 Anqing Hexing Chemical
6.5.1 Profile
6.5.2 Biodegradable Plastics Business
6.6 Others
6.6.1 Zhejiang Hisun Biomaterials Co., Ltd.
6.6.2 Ningbo Tianan Biologic Material Co., Ltd.
6.6.3 Zhejiang Tianhe Environmental Technology Co., Ltd.
6.6.4 Henan Yongle Biological Engineering Co., Ltd.
6.6.5 Maanshan Tong-Jie-Liang Biomaterials Co., Ltd.
6.6.6 Zhejiang Wafa Ecosystem Science & Technology Co., Ltd.
6.6.7 Fujian Beststarch Biodegradable Material Co., Ltd.
6.6.8 Guangdong Shangjiu Biodegradable Plastics Co., Ltd.
6.6.9 Shandong Fuwin New Material Co., Ltd.
6.6.10 Tianjin Danhai Co., Ltd.
6.6.11 Tianjin GreenBio Materials Co., Ltd.
6.6.12 Shenzhen BrightChina Industrial Co., Ltd.
6.6.13 Xinjiang Blue Ridge Tunhe Chemical Industry Joint Stock Co., Ltd
7. Summary and Forecast
7.1 Summary
7.2 Supply and Demand Forecast
7.2.1 Global Market
7.2.2 Chinese market
Classification and Usage of Biodegradable Plastics (by Raw Materials)
Biodegradable Plastics Industry Chain
Global Biodegradable Plastics Output, 2013-2015
Global Biodegradable Plastics Demand Structure by Usage, 2014
Global Biodegradable Plastics Output Structure by Variety, 2014
Global Biodegradable Plastics Demand Structure by Region, 2013
Global Biodegradable Plastics Capacity Structure by Region, 2014
Major Events of Japanese Enterprises Engaged in Biodegradable Plastic Application Development
Biodegradable Plastic Technology Development, 2008-2015
Main Biodegradable Plastic Enterprises and Their Capacity in the World, 2014
China’s Biodegradable Plastic Capacity and Growth Rate, 2009-2015
China’s Plastic Film Output and YoY Growth, 2009-2015
China’s Agricultural Film Output and YoY Growth, 2009-2015
Capacity of Main Biodegradable Plastics Enterprises in China, 2013
Policies of China’s Biodegradable Plastics Industry
Main Constituents and Source of PSM
Capacity Distribution of PSM Companies in the World, 2014
Properties and Applications of PLA
Capacity of Main PLA Companies in the World, 2014
Main Application of PHA in Medicine
Evolution of PHA
Capacity of Main PHA Companies in the World, 2014
Capacity of Main PBS Companies in the World, 2014
Main PPC Companies and Their Capacity in China, 2014
BASF’s Divisions and Main Business
BASF's Revenue and Net Income, 2010-2015
BASF's Revenue Structure (by Division), H1 2015
Revenue and EBITDA of BASF's Functional Materials & Solutions Division, 2012-2015
Sales of BASF's Functional Materials & Solutions Division (by Product), 2013-2015
Revenue Structure of BASF's Functional Materials & Solutions Division (by Product), 2013-2015
Revenue Structure of BASF's Functional Materials & Solutions Division (by Region), 2014
Composition and Usages of Ecoflex and Ecovio
DuPont's Net Sales and Net Income, 2010-2015
DuPont's Revenue Structure (by Division), 2013-2015
DuPont's Revenue Structure (by Region), 2012-2014
Net Sales and Net Income of Mitsubishi Chemical, FY2010-FY2014
Operational Fields and Main Business of Revenue Structure of Mitsubishi Chemical, FY2014
Net Sales and Net Income of Showa Denko, 2010-2015
Net Sales Structure of Showa Denko (by Division), H1 2015
Purac's Main Products and Business Fields
Corbion's Revenue and EBITDA, 2012-2015
Corbion's Net Sales Structure (by Division), 2014
Revenue Contribution of Corbion's Biochemical Division (by Product), 2014
Corbion's Net Sales Structure (by Region), 2014
Purac's Plants, 2014
Revenue and Net Income of Kingfa Sci & Tech, 2010-2015
Revenue of Kingfa Sci & Tech (by Product), 2013-2015
Revenue Structure of Kingfa Sci & Tech (by Product), 2013-2015
Revenue of Kingfa Sci & Tech (by Region), 2013-2015
Revenue Structure of Kingfa Sci & Tech (by Region), 2013-2015
R & D Costs and% of Total Revenue of Kingfa Sci & Tech, 2013-2015
Total Assets and Net Income of Zhuhai Wantong, 2012-2015
Revenue and Net Income of Yifan Xinfu Pharmaceutical, 2010-2015
Revenue of Yifan Xinfu Pharmaceutical (by Product), 2014-2015
Revenue Structure of Yifan Xinfu Pharmaceutical (by Product), 2014-2015
Revenue of Yifan Xinfu Pharmaceutical (by Region), 2014-2015
Revenue of Yifan Xinfu Pharmaceutical (by Region), 2014-2015
Gross Margin of Yifan Xinfu Pharmaceutical (by Product), 2014-2015
R & D Costs and% of Total Revenue of Yifan Xinfu Pharmaceutical, 2013-2015
Polymer Materials Revenue of Yifan Xinfu Pharmaceutical (by Product), 2012-2014
Polymer Materials Revenue Structure of Yifan Xinfu Pharmaceutical (by Product), 2012-2014
Gross Margin of Polymer Materials Business of Yifan Xinfu Pharmaceutical (by Product), 2014
Revenue and Net Income of Yifan Xinfu Pharmaceutical, 2014- 2018E
Revenue and Net Income of Shenzhen Rainbow Fine Chemical Industry, 2010-2015
Revenue of Shenzhen Rainbow Fine Chemical Industry (by Product), 2013-2015
Revenue Structure of Shenzhen Rainbow Fine Chemical Industry (by Product), 2013-2015
Revenue of Shenzhen Rainbow Fine Chemical Industry (by Region), 2013-2015
Revenue Structure of Shenzhen Rainbow Fine Chemical Industry (by Region), 2013-2015
R & D Costs and% of Total Revenue of Shenzhen Rainbow Fine Chemical Industry, 2013-2015
Output and Sales Volume of Bio-based Materials and Products of Shenzhen Rainbow Fine Chemical Industry, 2012-2014
Revenue and Net Income of Shenzhen Rainbow Fine Chemical Industry, 2013-2015
Revenue and Net Income of Shenzhen Rainbow Fine Chemical Industry, 2014- 2018E
Development Process of Biodegradable Plastics Business of Wuhan Huali Environment Technology
Global Demand and Output Structure of Biodegradable Plastics (by Region), 2014
Biodegradable Plastics Capacity Comparison between Global and Chinese Enterprises, 2014
Global Biodegradable Plastics Output and Growth Rate, 2014- 2018E
Global Biodegradable Plastics Applications, 2018E
Global Biodegradable Plastics Demand Structure (by Region), 2018E
Output of Plastic Films, Agricultural Film and Biodegradable Plastic Film in China, 2014-2018E
Global and China Synthetic Rubber Industry Report, 2021-2027
Synthetic rubber is a polymer product made of coal, petroleum and natural gas as main raw materials and polymerized with dienes and olefins as monomers, which is typically divided into general synthet...
Global and China Carbon Fiber Industry Report, 2021-2026
Carbon fiber is a kind of inorganic high performance fiber (with carbon content higher than 90%) converted from organic fiber through heat treatment. As a new material with good mechanical properties,...
Global and China Dissolving Pulp Industry Report, 2019-2025
In 2018, global dissolving pulp capacity outstripped 10 million tons and its output surged by 14.0% from a year ago to 7.07 million tons, roughly 70% of the capacity. China, as a key supplier of disso...
Global and China 1, 4-butanediol (BDO) Industry Report, 2019-2025
1,4-butanediol (BDO), an essential organic and fine chemical material, finds wide application in pharmaceuticals, chemicals, textile and household chemicals.
As of the end of 2018, the global BDO cap...
Global and China Carbon Fiber and CFRP Industry Report, 2019-2025
Among the world’s three major high performance fibers, carbon fiber features the highest strength and the highest specific modulus. It is widely used in such fields as aerospace, sports and leisure.
...
Global and China Natural Rubber Industry Report, 2019-2025
In 2018, global natural rubber industry continued remained at low ebb, as a result of economic fundamentals. Global natural rubber price presented a choppy downtrend and repeatedly hit a record low in...
Global and China Ultra High Molecular Weight Polyethylene (UHMWPE) Industry Report, 2019-2025
Ultra high molecular weight polyethylene (UHMWPE), a kind of linear polyethylene with relative molecular weight of above 1.5 million used as an engineering thermoplastic with excellent comprehensive p...
China Polyether Monomer Industry Report, 2019-2025
China has seen real estate boom and issued a raft of policies for continuous efforts in improving weak links in infrastructure sector over the years. Financial funds of RMB1,663.2 billion should be al...
Global and China Viscose Fiber Industry Report, 2019-2025
Over the recent years, the developed countries like the United States, Japan and EU members have withdrawn from the viscose fiber industry due to environmental factor and so forth, while the viscose f...
Global and China Synthetic Rubber (BR, SBR, EPR, IIR, NBR, Butadiene, Styrene, Rubber Additive) Industry Report, 2018-2023
In 2018, China boasted a total synthetic rubber capacity of roughly 6,667kt/a, including 130kt/a new effective capacity. Considering capacity adjustment, China’s capacity of seven synthetic rubbers (B...
Global and China Dissolving Pulp Industry Report, 2018-2022
With the commissioning of new dissolving pulp projects, the global dissolving pulp capacity had been up to about 8,000 kt by the end of 2017. It is worth noticing that the top six producers including ...
Global and China Carbon Fiber and CFRP Industry Report, 2018-2022
As a new generation of reinforced fiber boasting intrinsic properties of carbon material and excellent processability of textile fiber, carbon fiber is the one with the highest specific strength and s...
Global and China Ultra High Molecular Weight Polyethylene (UHMWPE) Industry Report, 2017-2021
Ultra High Molecular Weight Polyethylene (UHMWPE), a kind of linear polyethylene with relative molecular weight of above 1.5 million and an engineering thermoplastic with excellent comprehensive prope...
Global and China Aramid Fiber Industry Report, 2017-2021
Global aramid fiber output totaled 115kt with capacity utilization of 76.0% in 2016. As industries like environmental protection and military develop, the output is expected to rise to 138kt and capac...
Global and China Natural Rubber Industry Report, 2017-2021
In 2016, the global natural rubber output edged up 1.1% year on year to 12.4 million tons, and the consumption rose by 3.8% year on year to 12.6 million tons, indicating the gap of 200,000 tons betwee...
China Synthetic Rubber Industry Report, 2017-2021
Synthetic rubber is one of important strategic materials, mainly used in tyres and other industries. In 2016, the global output and consumption of synthetic rubber reached 14.822 million tons and 14.9...
Global and China 1,4-butanediol (BDO) Industry Report, 2017-2021
1,4-butanediol (BDO) is a key raw material for organic and fine chemicals, capable of generating various derivatives like THF, PTMEG and GBL. BDO and its derivatives find wide application in PBT plast...
Global and China Ethylene Oxide (EO) Industry Report, 2017-2021
Ethylene oxide (EO) is one of the major derivatives of the ethylene industry. Featured with special reactivity, it can generate a series of fine chemical products for a wide range of applications.
In...