Global and China Dissolving Pulp Industry Report, 2016-2020
-
May 2016
- Hard Copy
- USD
$2,500
-
- Pages:103
- Single User License
(PDF Unprintable)
- USD
$2,300
-
- Code:
HK070
- Enterprise-wide License
(PDF Printable & Editable)
- USD
$3,600
-
- Hard Copy + Single User License
- USD
$2,700
-
Dissolving pulp refers to the pulp with cellulose content above 90%, including primarily wood pulp, bamboo pulp and cotton pulp (dissolving pulp in this report just involves wood and bamboo pulp). Viscose fibre, the main application field, accounts for 3/4 of total consumption of dissolving pulp.
Global dissolving pulp capacity totaled about 7.5 million tons in 2015, mostly distributed in the regions/countries with rich forest resources including North America, South Africa, and Brazil. The world’s major dissolving pulp producers are Sappi, Aditya Birla, Lenzing, Sun Paper, Bracell, Rayonier, etc. which produce mainly dissolving wood pulp and hold a combined 57% share of the global total capacity. The dissolving pulp produced by Lenzing is completely used for in-house production of viscose fibre.
Globally, there are still a number of dissolving pulp projects under construction in 2016, such as Lenzing’s ongoing dissolving capacity expansion, Aditya Birla’s new 200kt dissolving pulp project in Laos, and Domtar’s 516kt dissolving pulp renovation project launched in early 2015. With ever-growing dissolving pulp capacity, global dissolving pulp prices will remain low on the whole over the next couple of years.
Exploding in 2011, China’s dissolving pulp capacity reached around 1.56 million tons at the end of 2015, making up 20.8% of the global total. Despite large dissolving pulp capacity in China, most of facilities have stopped production or shifted to paper pulp due to continued losses of dissolving pulp producers in recent years. Actual output of dissolving pulp was less than 200kt in 2015.
Dissolving Pulp Capacity and Output in China, 2010-2015
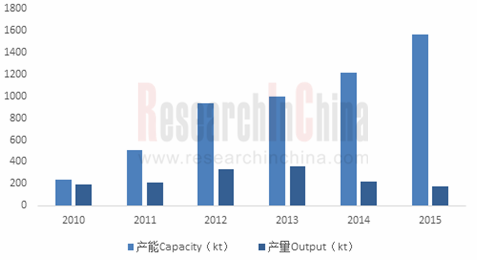
Source: ResearchInChina
Because of a shortage of forest resources, the Chinese dissolving pulp companies have been plagued with higher production costs and weaker competitiveness. During 2012-2015, due to sluggish demand for viscose staple fiber, dissolving pulp overcapacity, and impact of international low-cost dissolving pulp on domestic market, the dissolving pulp sector in China almost suffered losses across the industry. With the implementation of the Chinese government’s anti-dumping rulings and gradual recovery of downstream viscose staple fiber industry, it is expected the country’s dissolving pulp sector will bottom out during 2016-2020 with output and apparent consumption of dissolving pulp amounting to 320 kt and 3,184 kt respectively in 2020.
The Chinese dissolving pulp market underwent great changes in competitive landscape in 2015, as the leading Sun Paper continued to significantly expand its dissolving pulp capacity with 350kt dissolving pulp capacity put into production in November which brought total capacity up to 500kt/a, Yueyang Forest & Paper and Jilin Chemical Fiber swapped their dissolving pulp assets with big shareholders for other items and held no such assets, and Fujian Nanping Paper and YanbianShixian Double-deer Industrial restructured their businesses and spun off paper products and dissolving pulp businesses due to years of losses.
Global and China Dissolving Pulp Industry Report, 2016-2020 by ResearchInChina focuses on the followings:
 Global dissolving pulp industry (market size, competitive landscape, prices, etc.);
China’s dissolving pulp industry (market size, competitive landscape, imports/exports, prices, development forecast, etc.);
Chinese viscose fiber industry (market size, competitive landscape, imports/exports, prices, development forecast, etc.);
12 global and Chinese dissolving pulp producers (operation, dissolving pulp business, forecast and prospects, etc.)
1 Overview of Dissolving Pulp Industry
1.1 Definition and Classification
1.2 Industry Chain
2 Overview of Global Dissolving Pulp Industry
2.1 Development Situation
2.2 Price Analysis
3 Chinese Dissolving Pulp Industry
3.1 Development Situation
3.2 Anti-dumping Investigation
3.3 Supply
3.4 Demand
3.5 Import & Export
3.5.1 Import & Export Volume
3.5.2 Import Countries and Regions
3.6 Competitive Landscape
3.7 Price Analysis
4Downstream Viscose Fiber Market
4.1 Overview
4.2 Capacity
4.3 Output
4.4 Import & Export
4.4.1 Import & Export Volume
4.4.2 Import & Export Countries
4.4.3 Import & Export Regions
4.5 Price Analysis
5 World’s Major Dissolving Pulp Companies
5.1 Bracell
5.1.1 Profile
5.1.2 Operation
5.1.3 Gross Margin
5.1.4 Dissolving Pulp Business
5.1.5 Business in China
5.2 Sappi
5.2.1 Profile
5.2.2 Operation
5.2.3 Revenue Structure
5.2.4 Dissolving Pulp Business
5.2.5 Business in China
5.3 Aditya Birla
5.3.1 Profile
5.3.2 Operation of Grasim
5.3.3 Dissolving Pulp Business of Grasim
5.3.4 Business in China
5.4 Lenzing
5.4.1 Profile
5.4.2 Operation
5.4.3 Operation of Fiber Segment
5.4.4 Dissolving Pulp Business
5.4.5 Business in China
6 Major Chinese Dissolving Pulp Companies
6.1 Shandong Sun Paper Industry Joint Stock Co., Ltd.
6.1.1 Profile
6.1.2 Operation
6.1.3 Revenue Structure
6.1.4 Gross Margin
6.1.5 Dissolving Pulp Business
6.1.6 Forecast and Outlook
6.2 Jilin Chemical Fibre Co., Ltd.
6.2.1 Profile
6.2.2 Operation
6.2.3 Revenue Structure
6.2.4 Gross Margin
6.2.5 Dissolving Pulp Business
6.2.6 Forecast and Outlook
6.3 YanbianShixianDouble-deer Industrial Co., Ltd.
6.3.1 Profile
6.3.2 Operation
6.3.3 Revenue Structure
6.3.4 Gross Margin
6.3.5 Clients and Suppliers
6.3.6 Dissolving Pulp Business
6.4 Fujian Qingshan Paper Industry Co.,Ltd.
6.4.1 Profile
6.4.2 Operation
6.4.3 Revenue Structure
6.4.4 Gross Margin
6.4.5 Dissolving Pulp Business
6.4.6 Forecast and Outlook
6.5 Yueyang Forest & Paper Co., Ltd.
6.5.1 Profile
6.5.2 Operation
6.5.3 Revenue Structure
6.5.4 Gross Margin
6.5.5 Dissolving Pulp Business
6.5.6 Forecast and Outlook
6.6 Shandong Chenming Paper Holdings Ltd
6.6.1 Profile
6.6.2 Operation
6.6.3 Revenue Structure
6.6.4 Gross Margin
6.6.5 Clients and Suppliers
6.6.6 Dissolving Pulp Business
6.6.7 Forecast and Outlook
6.7 Shandong Huatai Paper Co., Ltd.
6.7.1 Profile
6.7.2 Operation
6.7.3 Revenue Structure
6.7.4 Gross Margin
6.7.5 Dissolving Pulp Business
6.7.6 Forecast and Outlook
6.8 Yibin Grace Group Co., Ltd.
6.8.1 Profile
6.8.2 Dissolving Pulp Business
7 Conclusion and Prediction
7.1 Summary
7.2 Development Forecast
7.2.1 Supply and Demand
7.2.2 Downstream
Mainstream Industrial Chain of Dissolving Wood Pulp
Other Downstream Products and Applications of Dissolving Pulp
Major Global Dissolving Pulp Manufacturers and Their Capacity, 2015
Key Dissolving Pulp Projects Planned/Under Construction Worldwide, 2016
Trend of Dissolving Pulp Prices Worldwide, 2011-2015
Dissolving Pulp Capacity and Output in China, 2010-2015
Capacity of Dissolving Pulp Manufacturers in China, 2015
Apparent Consumption of Dissolving Pulp in China, 2010-2015
Dissolving Pulp Imports/Exports in China, 2010-2015
Average Import & Export Prices of Dissolving Pulp in China, 2010-2015
Source Structure of Dissolving Pulp Imports in China by Import Volume, 2015
Average Import Prices of Dissolving Pulp in China by Country, 2015
Major Dissolving Pulp Import Provinces/Municipalities and Their Import Volume in China (%), 2015
Dissolving Pulp Manufacturers in China and Their Capacity (%), 2015
Market Prices of Dissolving Pulp in China, 2012-2016
Major Varieties of Fiber Worldwide
Fiber Consumption Structure Worldwide, 2015
Major Viscose Staple Fiber Manufacturers in China and Their Capacity, 2015
Distribution of Viscose Staple Fiber Capacity in China by Region, 2015
Major Viscose Staple Fiber Manufacturers in China and Their Capacity (%), 2015
Viscose Fiber Output and YoY Growth in China, 2006-2015
Viscose Staple Fiber Imports/Exports in China, 2010-2015
Average Import/Export Prices of Viscose Staple Fiber in China, 2010-2015
Destinations of Exported Viscose Staple Fiber from China by Export Volume, 2015
Sources of Imported Viscose Staple Fiber in China by Import Volume, 2015
Major Viscose Staple Fiber Export Cities and Their Export Volume in China (%), 2015
Major Viscose Staple Fiber Import Cities and Their Import Volume in China (%), 2015
Market Prices of Viscose Staple Fiber and Viscose Filament Yarn in China, 2008-2016
Product Line and Applications of Bracell
Revenue and Net Income of Bracell, 2010-2015
Gross Margin of Major Products of Bracell, 2010-2015
Varieties and Applications of Bracell’sDissolving Wood Pulp
Dissolving Pulp Revenue Breakdown (by Region) of Bracell, 2013-2015
Dissolving Pulp Revenue Structure (by Region) of Bracell, 2013-2015
Dissolving Wood Pulp Output and Sales of Bracell, 2013-2015
Viscose Pulp’s % of Bracell’s Dissolving Pulp Sales, 2013-2015
SpecialtyPulp’s % of Bracell’sDissolving Wood Pulp Sales, 2013-2015
Average Selling Prices of Bracell’sDissolving Wood Pulp, 2010-2015
Sappi’s Three Major Production Bases and Capacity of Major Products, 2015
Revenue and EBITDA of Sappi, 2010-2015
Revenue Breakdown (by Branches) of Sappi, 2012-2015
Revenue Structure (by Branches) of Sappi, 2012-2015
Revenue Structure (by Product) of Sappi, 2013-2015
Revenue Breakdown (by Region) of Sappi, 2012-2015
Revenue Structure (by Region) of Sappi, 2012-2015
Dissolving Pulp Manufacturing Plants and Capacity of Sappi, 2015
Sappi’s Dissolving Pulp Business Revenue and EBITDA, 2012-2015
Net Revenue and Net Income of Grasim, FY2010-FY2015
Net Revenue Structure (by Product) of Grasim, FY2012-FY2015
Grasim’s Manufacturing Plants and Capacity of Major Products, 2015
Grasim’s Net Revenue and Growth Rate of Viscose Staple Fiber and Dissolving Pulp, FY2010-FY2015
Revenue and EBITDA of Lenzing, 2010-2015
Revenue Structure (by Division) of Lenzing, 2012-2015
Revenue Structure (by Region) of Lenzing, 2012-2015
Revenue and EBITDA of Lenzing’s Fiber Division, 2010-2015
Revenue Breakdown (by Product) of Lenzing’s Fiber Division, 2012-2015
Revenue Structure (by Product) of Lenzing’s Fiber Division, 2012-2015
Dissolving Pulp Related Subsidiaries and Their Capacity of Lenzing, 2015
Revenue and Net Income of Lenzing (Nanjing) Fiber Co., Ltd., 2010-2015
Revenue and Net Income of Shandong Sun Paper Industry Joint Stock, 2010-2015
Revenue Breakdown (by Product) of Shandong Sun Paper Industry Joint Stock, 2012-2015
Revenue Structure (by Product) of Shandong Sun Paper Industry Joint Stock, 2012-2015
Revenue Breakdown (by Region) of Shandong Sun Paper Industry Joint Stock, 2012-2015
Revenue Structure (by Region) of Shandong Sun Paper Industry Joint Stock, 2012-2015
Gross Margin of Major Products of Shandong Sun Paper Industry Joint Stock, 2012-2015
Revenue and Net Income of Shandong Sun Paper Industry Joint Stock, 2016-2020E
Capacity of Major Products of Jilin Chemical Fibre, 2015
Revenue and Net Income of Jilin Chemical Fibre, 2010-2015
Revenue Breakdown (by Product) of Jilin Chemical Fibre, 2012-2015
Revenue Structure (by Product) of Jilin Chemical Fibre, 2012-2015
Revenue Breakdown (by Region) of Jilin Chemical Fibre, 2012-2015
Revenue Structure (by Region) of Jilin Chemical Fibre, 2012-2015
Gross Margin of Major Products of Jilin Chemical Fibre, 2012-2015
Revenue and Net Income of Jilin Chemical Fibre, 2016-2020E
Revenue and Net Income of YanbianShixianDouble-deer Industrial, 2010-2015
Revenue Breakdown (by Product) of YanbianShixianDouble-deer Industrial, 2012-2015
Revenue Structure (by Product) of YanbianShixianDouble-deer Industrial, 2012-2015
Revenue Breakdown (by Region) of YanbianShixianDouble-deer Industrial, 2012-2014
Revenue Structure (by Region) of YanbianShixianDouble-deer Industrial, 2012-2014
Gross Margin of Major Products of YanbianShixianDouble-deer Industrial, 2012-2015
YanbianShixianDouble-deer Industrial’s Revenue from Top 5 Clients and % of Total Revenue, 2012-2015
Name List and Revenue Contribution of YanbianShixianDouble-deer Industrial’s Top 5 Clients, 2015H1
YanbianShixianDouble-deer Industrial’s Procurement from Top 5 Suppliers and % of Total Procurement, 2013-2015
Name List and Procurement of YanbianShixianDouble-deer Industrial’s Top 5 Suppliers, 2015H1
Dissolving Pulp Output and Sales Volume of YanbianShixianDouble-deer Industrial, 2012-2015
Revenue and Net Income of Fujian Qingshan Paper Industry, 2010-2015
Revenue Breakdown (by Product) of Fujian Qingshan Paper Industry, 2012-2015
Revenue Structure (by Product) of Fujian Qingshan Paper Industry, 2012-2015
Revenue Breakdown (by Region) of Fujian Qingshan Paper Industry, 2012-2015
Revenue Structure (by Region) of Fujian Qingshan Paper Industry, 2012-2015
Gross Margin of Major Products of Fujian Qingshan Paper Industry, 2012-2015
Revenue and Net Income of Fujian Qingshan Paper Industry, 2016-2020E
Revenue and Net Income of Yueyang Forest & Paper, 2010-2015
Revenue Breakdown (by Product) of Yueyang Forest & Paper, 2013-2015
Revenue Structure (by Product) of Yueyang Forest & Paper, 2013-2015
Revenue Breakdown (by Region) of Yueyang Forest & Paper, 2012-2015
Revenue Structure (by Region) of Yueyang Forest & Paper, 2012-2015
Gross Margin of Major Products of Yueyang Forest & Paper, 2015
Revenue and Net Income of Juntai Paper, 2011-2015
Revenue and Net Income of Yueyang Forest & Paper, 2016-2020E
Revenue and Net Income of Shandong Chenming Paper, 2010-2015
Revenue Breakdown (by Product) of Shandong Chenming Paper, 2012-2015
Revenue Structure (by Product) of Shandong Chenming Paper, 2012-2015
Revenue Breakdown (by Region) of Shandong Chenming Paper, 2012-2015
Revenue Structure (by Region) of Shandong Chenming Paper, 2012-2015
Gross Margin of Major Products of Shandong Chenming Paper, 2012-2015
Shandong Chenming Paper’s Revenue from Top 5 Clients and % of Total Revenue, 2012-2015
Name List and Revenue Contribution of Shandong Chenming Paper’s Top 5 Clients, 2015
Shandong Chenming Paper’s Procurement from Top 5 Suppliers and % of Total Procurement, 2012-2015
Name List and Procurement of Chenming Paper’s Procurement from Top 5 Suppliers, 2015
Revenue and Net Income of Shandong Chenming Paper, 2016-2020E
Revenue and Net Income of Shandong Huatai Paper, 2010-2015
Revenue Breakdown (by Product) of Shandong Huatai Paper, 2012-2015
Revenue Structure (by Product) of Shandong Huatai Paper, 2012-2015
Revenue Structure (by Region) of Shandong Huatai Paper, 2012-2015
Revenue Structure (by Region) of Shandong Huatai Paper, 2012-2015
Gross Margin of Major Products of Shandong Huatai Paper, 2012-2015
Revenue and Net Income of Anhui Huatai, 2012-2015
Revenue and Net Income of Shandong Huatai Paper, 2016-2020E
Capacity of Major Products of Yibin Grace Group, 2015
Comparison between Global and Chinese Dissolving Pulp Manufacturers in Operation, 2014-2015
Supply and Demand in China Dissolving Pulp Industry, 2016-2020E
Supply and Demand in China Viscose Fiber Industry, 2016-2020E
Global and China Synthetic Rubber Industry Report, 2021-2027
Synthetic rubber is a polymer product made of coal, petroleum and natural gas as main raw materials and polymerized with dienes and olefins as monomers, which is typically divided into general synthet...
Global and China Carbon Fiber Industry Report, 2021-2026
Carbon fiber is a kind of inorganic high performance fiber (with carbon content higher than 90%) converted from organic fiber through heat treatment. As a new material with good mechanical properties,...
Global and China Dissolving Pulp Industry Report, 2019-2025
In 2018, global dissolving pulp capacity outstripped 10 million tons and its output surged by 14.0% from a year ago to 7.07 million tons, roughly 70% of the capacity. China, as a key supplier of disso...
Global and China 1, 4-butanediol (BDO) Industry Report, 2019-2025
1,4-butanediol (BDO), an essential organic and fine chemical material, finds wide application in pharmaceuticals, chemicals, textile and household chemicals.
As of the end of 2018, the global BDO cap...
Global and China Carbon Fiber and CFRP Industry Report, 2019-2025
Among the world’s three major high performance fibers, carbon fiber features the highest strength and the highest specific modulus. It is widely used in such fields as aerospace, sports and leisure.
...
Global and China Natural Rubber Industry Report, 2019-2025
In 2018, global natural rubber industry continued remained at low ebb, as a result of economic fundamentals. Global natural rubber price presented a choppy downtrend and repeatedly hit a record low in...
Global and China Ultra High Molecular Weight Polyethylene (UHMWPE) Industry Report, 2019-2025
Ultra high molecular weight polyethylene (UHMWPE), a kind of linear polyethylene with relative molecular weight of above 1.5 million used as an engineering thermoplastic with excellent comprehensive p...
China Polyether Monomer Industry Report, 2019-2025
China has seen real estate boom and issued a raft of policies for continuous efforts in improving weak links in infrastructure sector over the years. Financial funds of RMB1,663.2 billion should be al...
Global and China Viscose Fiber Industry Report, 2019-2025
Over the recent years, the developed countries like the United States, Japan and EU members have withdrawn from the viscose fiber industry due to environmental factor and so forth, while the viscose f...
Global and China Synthetic Rubber (BR, SBR, EPR, IIR, NBR, Butadiene, Styrene, Rubber Additive) Industry Report, 2018-2023
In 2018, China boasted a total synthetic rubber capacity of roughly 6,667kt/a, including 130kt/a new effective capacity. Considering capacity adjustment, China’s capacity of seven synthetic rubbers (B...
Global and China Dissolving Pulp Industry Report, 2018-2022
With the commissioning of new dissolving pulp projects, the global dissolving pulp capacity had been up to about 8,000 kt by the end of 2017. It is worth noticing that the top six producers including ...
Global and China Carbon Fiber and CFRP Industry Report, 2018-2022
As a new generation of reinforced fiber boasting intrinsic properties of carbon material and excellent processability of textile fiber, carbon fiber is the one with the highest specific strength and s...
Global and China Ultra High Molecular Weight Polyethylene (UHMWPE) Industry Report, 2017-2021
Ultra High Molecular Weight Polyethylene (UHMWPE), a kind of linear polyethylene with relative molecular weight of above 1.5 million and an engineering thermoplastic with excellent comprehensive prope...
Global and China Aramid Fiber Industry Report, 2017-2021
Global aramid fiber output totaled 115kt with capacity utilization of 76.0% in 2016. As industries like environmental protection and military develop, the output is expected to rise to 138kt and capac...
Global and China Natural Rubber Industry Report, 2017-2021
In 2016, the global natural rubber output edged up 1.1% year on year to 12.4 million tons, and the consumption rose by 3.8% year on year to 12.6 million tons, indicating the gap of 200,000 tons betwee...
China Synthetic Rubber Industry Report, 2017-2021
Synthetic rubber is one of important strategic materials, mainly used in tyres and other industries. In 2016, the global output and consumption of synthetic rubber reached 14.822 million tons and 14.9...
Global and China 1,4-butanediol (BDO) Industry Report, 2017-2021
1,4-butanediol (BDO) is a key raw material for organic and fine chemicals, capable of generating various derivatives like THF, PTMEG and GBL. BDO and its derivatives find wide application in PBT plast...
Global and China Ethylene Oxide (EO) Industry Report, 2017-2021
Ethylene oxide (EO) is one of the major derivatives of the ethylene industry. Featured with special reactivity, it can generate a series of fine chemical products for a wide range of applications.
In...