Global and China Viscose Fiber Industry Report, 2019-2025
-
May 2019
- Hard Copy
- USD
$2,900
-
- Pages:120
- Single User License
(PDF Unprintable)
- USD
$2,700
-
- Code:
CYH082
- Enterprise-wide License
(PDF Printable & Editable)
- USD
$4,100
-
- Hard Copy + Single User License
- USD
$3,100
-
Over the recent years, the developed countries like the United States, Japan and EU members have withdrawn from the viscose fiber industry due to environmental factor and so forth, while the viscose fiber is in full swing in Asian regions, particularly in China, with a significant rise in both capacity and output. In 2018, the global output of viscose fiber reached approximately 5.8 million tons to which China contributed 65% or so.
As the world leaders in viscose fiber, the Austria-based Lenzing and the India-based Aditya Birla Group (with its viscose business undertaken by Grasim) boasted production capacity of more than 800 kt/a apiece in 2018. Besides, the players in possession of large capacity come mainly from China.
Of viscose fiber products, viscose staple fiber is produced largely in China and its capacity/output takes a lion’s share of as high as 90% or so. As of the end of 2018, China’s capacity of viscose staple fiber grew at an ever faster rate and posted 4.75 million tons, an addition of 700 kt from 2017.
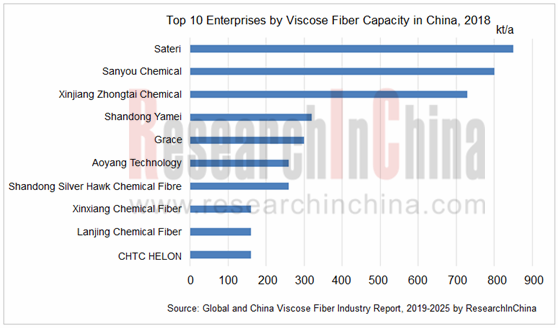
In the Chinese viscose staple fiber market featuring a fairly high concentration ratio, the six leading manufacturers (including Sateri (China), Sanyou Chemical, Xinjiang Zhongtai Chemical, Grace, Shandong Silver Hawk Chemical Fibre, Aoyang Technology) hold a combined share of 74.1% in such market segment. Of them, Sateri boasted the biggest capacity of viscose staple fiber in China, with its three factories at the end of 2018 capable of producing a total of 850 kt/a, a figure then lifted to 1,100 kt/a in April 2019 when Sateri acquired the heavily indebted Jiangsu Xiangsheng Viscose Fiber Co., Ltd.
With other enterprises’ production expansion projects and the ones under construction included, in China, there will be an additional capacity of roughly 350 kilotons in 2019 when the total capacity of viscose fiber will foot up to 5,100 kilotons. With technical advances, the effective production capacity of viscose fiber will continue to grow domestically and the products get increasingly differentiated for a high-end trend.
As a result of the great impact of capacity increment on the market, the growing stringent environmental campaign across the country as well as the depressed market demand for rayon yarn, the market price of viscose staple fiber showed a downward mobility and touched the bottom in December 2018, causing the loss-making of the vast majority of viscose firms. It is expected that the market price of viscose staple fiber will rise to a limited extent in 2019.
As for imports and exports, the China-US trade war in 2018 inflicted the Chinese viscose fiber market a bit. From 2011 to 2018, China’s viscose fiber exports maintained steady growth, of which the exports of viscose staple fiber stood at 370 kilotons and presented a CAGR of 12.5% in 2018. China’s export of viscose fiber is anticipated to remain sound with stronger competitiveness as the production capacity gets beefed up and the rate of fiber differentiation climbs.
The report mainly includes the following aspects:
 Supply, regional structure, competition pattern and trends of global viscose fiber market;
Supply, capacity, competition pattern, policies, import, export and prices of Chinese viscose fiber market;
Market development and tendencies of upstream dissolving pulp and downstream rayon yarn;
Operation, viscose fiber business and development of 17 Chinese and foreign viscose fiber manufacturers.
1 Overview of Viscose Fiber
1.1 Definition and Characteristics
1.2 Classification and Application
1.3 Industry Chain
2 Global Viscose Fiber Industry
2.1 Overall Development
2.2 Market Size
2.3 Regional structure
2.4 Competition Pattern
2.5 Development Trend
3 China Viscose Fiber Market
3.1 Overall Development
3.1.1 Overview
3.1.2 Policy
3.2 Market Supply and Demand
3.2.1 Capacity
3.2.2 Output
3.2.3 Demand
3.3 Import and Export
3.4 Price
3.5 Competition Pattern
3.6 Development Trend
4 China Viscose Fiber Industry Chain Market
4.1 Upstream Dissolving Pulp Market
4.1.1 Market Overview
4.1.2 Company
4.1.3 Import & Export
4.1.4 Price
4.1.5 Development Trend
4.2 Downstream Rayon Yarn Market
4.2.1 Market Overview
4.2.2 Regional structure
4.2.3 Price
5 Key Foreign Enterprises
5.1 Lenzing
5.1.1 Profile
5.1.2 Operation
5.1.3 Viscose Fiber Business
5.1.4 Business in China
5.1.5 Development Planning
5.2 Grasim
5.2.1 Profile
5.2.2 Operation
5.2.3 Viscose Fiber Business
5.2.4 Business in China
5.3 Sateri
5.3.1 Profile
5.3.2 Viscose Fiber Business
5.3.3 Business in China
6 Key Chinese Enterprises
6.1 China HI-TECH Group Corporation
6.1.1 Profile
6.1.2 Viscose Fiber Business
6.1.3 Development Dynamics
6.2 Jiangsu Aoyang Health Industry Co., Ltd.
6.2.1 Profile
6.2.2 Operation
6.2.3 Viscose Fiber Business
6.2.4 Development Strategy
6.3 Xinxiang Chemical Fiber
6.3.1 Profile
6.3.2 Operation
6.3.3 Viscose Fiber Business
6.3.4 Development Strategy
6.4 Nanjing Chemical Fiber
6.4.1 Profile
6.4.2 Operation
6.4.3 Viscose Fiber Business
6.4.4 Development Strategy
6.5 Jilin Chemical Fibre
6.5.1 Profile
6.5.2 Operation
6.5.3 Viscose Fiber Business
6.5.4 Development Strategy
6.6 Xinjiang Zhongtai Chemical
6.6.1 Profile
6.6.2 Operation
6.6.3 Viscose Fiber Business
6.6.4 Development Strategy
6.7 Sanyou Chemical
6.7.1 Profile
6.7.2 Operation
6.7.3 Viscose Fiber Business
6.7.4 Development Strategy
6.8 Hubei Golden Ring New Materials
6.8.1 Profile
6.8.2 Operation
6.8.3 Viscose Fiber Business
6.9 Yibin Grace Group
6.9.1 Profile
6.9.2 Operation
6.9.3 Viscose Fiber Business
6.9.4 Development Dynamics
6.10 Others
6.10.1 Shandong Yamei Technology Co., Ltd.
6.10.2 Longda (Jiangxi) Chemical Fiber
6.10.3 Shandong Silver Hawk Chemical Fibre
6.10.4 Anhui Somet Fiber
6.10.5 Shandong Yingli Industrial Co., Ltd.
Viscose Fiber industry Chain
Global Viscose Fiber Output and Growth Rate, 2006-2018
Global Viscose Fiber Output by Region, 2018
Capacity of the World’s Top 10 Viscose Fiber Manufacturers, 2018
Global Viscose Fiber Output and Growth Rate, 2019-2025
Operating Revenue and YoY Change of China Cellulose Fiber Materials and Fiber Manufacturing, 2010-2018
Total Profit and YoY Growth Rate of China Cellulose Fiber Materials and Fiber Manufacturing, 2010-2018
List of Enterprises Subject to Viscose Fiber Industry Access Conditions (First Batch)
China’s Fiber Output Structure by Main Varieties, 2012-2018
Operating Revenue and YoY Growth Rate of China Chemical Fiber Manufacturing, 2010-2018
Capacity of China’s Leading Viscose Fiber Manufacturers, 2018
Major Chinese VSF Manufacturers and Capacity Proportion, 2018
Major Chinese VFY Manufacturers and Capacity Proportion, 2018
China’s Viscose Fiber Output and YoY Change, 2010-2018
China’s Viscose Fiber Output by Product, 2010-2018
China’s Viscose Fiber Output by Region, 2018
China’s VSF Import and Export Volume, 2010-2018
China’s VSF Import and Export Prices, 2010-2018
China’s VSF and VFY Market Prices, 2018
China’s Viscose Fiber Output and YoY Change, 2019-2025
China’s Dissolving Pulp Output and YoY Change, 2015-2025
Capacity of China’s Leading Dissolving Pulp Manufacturers, 2018
Dissolving Pulp Production Expansion Projects of Key Chinese Enterprises, 2019
Import/Export Volume of Dissolving Pulp in China, 2015-2018
China’s Dissolving Pulp Market Prices, 2018
China’s Rayon Yarn Output and YoY Growth Rate, 2015-2025
China’s Rayon Yarn Output by Region, 2018
China’s Rayon Yarn Market Prices, 2018
Lenzing’s Sales and EBITDA, 2010-2018
Lenzing’s Sales Structure by Division, 2010-2018
Sales and EBIT of Lenzing Fiber Division, 2010-2018
Sales Structure of Lenzing Fiber Division by Product, 2010-2018
Sales Structure of Lenzing Fiber Division by Region, 2010-2018
Capacity of Lenzing’s Viscose Fiber Subsidiaries, 2018
Lenzing’s Total Fiber Output and Growth Rate, 2010-2018
Sales Structure of Lenzing Fiber Division by Product, 2010-2018
Revenue and Net Income of Lenzing (Nanjing) Fibers, 2010-2018
Grasim’s Net Revenue and Net Income, 2010-2018
Grasim’s Net Revenue Structure by Product, 2010-2018
Capacity of Grasim’s Main Production Plants, 2018
Grasim’s VSF Output, Sales Volume and Sales-Output Ratio, 2010-2018
Grasim’s VSF Net Revenue and Growth Rate, 2010-2018
Sateri’s Product Chain and Usage
Sateri’s Revenue and Net Income, 2010-2018
Sateri’s Revenue by Product, 2010-2018
Sateri’s Revenue Structure by Product, 2010-2018
Sateri’s Revenue by Region, 2010-2018
Sateri’s Revenue Structure by Region, 2010-2018
Sateri’s Gross Margin by Product, 2010-2018
Sateri’s VSF Output, Sales Volume and Sales-Output Ratio, 2010-2018
Sateri’s Average Selling Prices for VSP and DWP, 2010-2018
Capacity of Main Products of CHTC HELON, 2018
Revenue and Net Income of CHTC HELON, 2010-2018
Revenue of CHTC HELON by Product, 2010-2018
Revenue Structure of CHTC HELON by Product, 2010-2018
Revenue of CHTC HELON by Region, 2010-2018
Revenue Structure of CHTC HELON by Region, 2010-2018
Gross Margin of Viscose Fiber Products of CHTC HELON, 2010-2018
Revenue of CHTC HELON from Top 5 Clients and % of Total Revenue, 2010-2018
Name List and Revenue Contribution of Top 5 Clients of CHTC HELON, 2018
Subsidiaries of CHTC HELON, 2018
Revenue and Net Income of CHTC HELON, 2010-2018
Revenue and Net Income of Aoyang Technology, 2010-2018
VSF Revenue and Growth Rate of Aoyang Technology, 2010-2018
Revenue Structure of Aoyang Technology by Product, 2010-2018
Revenue of Aoyang Technology by Region, 2010-2018
Revenue Structure of Aoyang Technology by Region, 2010-2018
VSF Gross Margin of Aoyang Technology, 2010-2018
Revenue of Aoyang Technology from Top 5 Clients and % of Total Revenue, 2010-2018
Revenue of Aoyang Technology from Top 5 Clients and % of Total Revenue, 2018
Revenue and Net Income of Manasi Aoyang Technology, 2010-2018
Revenue and Net Income of Funing Aoyang Technology, 2010-2018
Revenue and Net Income of Xinao Special Fiber, 2010-2018
Revenue and Net Income of Aoyang Technology, 2010-2018
Production of Main Products of Xinxiang Chemical Fiber, 2010-2018
Revenue and Net Income of Xinxiang Chemical Fiber, 2010-2018
Operating Revenue of Xinxiang Chemical Fiber by Product, 2010-2018
Operating Revenue Structure of Xinxiang Chemical Fiber by Product, 2010-2018
Operating Revenue of Xinxiang Chemical Fiber by Region, 2010-2018
Operating Revenue Structure of Xinxiang Chemical Fiber by Region, 2010-2018
Gross Margin of Main Products of Xinxiang Chemical Fiber, 2010-2018
Revenue of Xinxiang Chemical Fiber from Top 5 Clients and % of Total Revenue, 2010-2018
Name List and Revenue Contribution of Top 5 Clients of Xinxiang Chemical Fiber, 2018
VSF and VFY Output of Xinxiang Chemical Fiber, 2010-2018
Xinxiang Chemical Fiber’s Projects under Construction, 2018
Revenue and Net Income of Xinxiang Chemical Fiber, 2010-2018
Revenue and Net Income of Nanjing Chemical Fiber, 2010-2018
Operating Revenue of Nanjing Chemical Fiber by Product, 2010-2018
Operating Revenue Structure of Nanjing Chemical Fiber by Product, 2010-2018
Operating Revenue of Nanjing Chemical Fiber by Region, 2010-2018
Gross Margin of Viscose Fiber Products of Nanjing Chemical Fiber, 2010-2018
Revenue of Nanjing Chemical Fiber from Top 5 Clients and % of Total Revenue, 2010-2018
Name List and Revenue Contribution of Top 5 Clients of Nanjing Chemical Fiber, 2018
Viscose Fiber Output of Nanjing Chemical Fiber, 2010-2018
Viscose Fiber Sales Volume of Nanjing Chemical Fiber, 2010-2018
Revenue and Net Income of Viscose Fiber Subsidiaries of Nanjing Chemical Fiber, 2018
Revenue and Net Income of Nanjing Chemical Fiber, 2010-2018
Revenue and Net Income of Jilin Chemical Fibre, 2010-2018
Operating Revenue of Jilin Chemical Fibre by Product, 2010-2018
Operating Revenue Structure of Jilin Chemical Fibre by Product, 2010-2018
Revenue of Jilin Chemical Fibre by Region, 2010-2018
Revenue Structure of Jilin Chemical Fibre by Region, 2010-2018
Gross Margin of Main Products of Jilin Chemical Fibre, 2010-2018
Revenue of Jilin Chemical Fibre from Top 5 Clients and % of Total Revenue, 2010-2018
Name List and Revenue Contribution of Top 5 Clients of Jilin Chemical Fibre, 2018
Capacity of Main Products of Jilin Chemical Fibre, 2018
Operation of Viscose Fiber Subsidiaries of Jilin Chemical Fibre, 2018
Revenue and Net Income of Jilin Chemical Fibre, 2010-2018
Revenue and Net Income of Swan Fiber, 2010-2018
Revenue of Swan Fiber (by Product), 2010-2018
Revenue Structure of Swan Fiber by Product, 2010-2018
Revenue of Swan Fiber by Region, 2010-2018
Revenue Structure of Swan Fiber by Region, 2010-2018
Gross Margin of Main Products of Swan Fiber, 2010-2018
Revenue of Swan Fiber from Top 5 Clients and % of Total Revenue, 2010-2018
Name List and Revenue Contribution of Top 5 Clients of Swan Fiber, 2018
Capacity of Main Products of Swan Fiber, 2018
VFY Revenue of Swan Fiber, 2010-2018
VFY Revenue Structure of Swan Fiber by Region, 2010-2018
Revenue and Net Income of Swan Fiber, 2010-2018
Revenue and Net Income of Sanyou Chemical, 2010-2018
Operating Revenue of Sanyou Chemical by Product, 2010-2018
Revenue Structure of Sanyou Chemical by Product, 2010-2018
Revenue of Sanyou Chemical by Region, 2010-2018
Revenue Structure of Sanyou Chemical by Region, 2010-2018
Gross Margin of Main Products of Sanyou Chemical, 2010-2018
Revenue of Sanyou Chemical from Top 5 Clients and % of Total Revenue, 2010-2018
Name List and Revenue Contribution of Top 5 Clients of Sanyou Chemical, 2018
The Subsidiary - XingDa Chemical Fiber, 2018
Revenue and Net Income of XingDa Chemical Fiber, 2010-2018
Revenue and Net Income of Sanyou Chemical, 2010-2018
Capacity of Main Products of Hubei Golden Ring, 2018
Revenue and Net Income of Hubei Golden Ring, 2010-2018
Revenue of Hubei Golden Ring by Product, 2010-2018
Revenue Structure of Hubei Golden Ring by Product, 2010-2018
Gross Margin of Viscose Fiber Business of Hubei Golden Ring, 2010-2018
Revenue of Hubei Golden Ring from Top 5 Clients and % of Total Revenue, 2010-2018
Name List and Revenue Contribution of Top 5 Clients of Hubei Golden Ring, 2018
Revenue and Net Income of Hubei Golden Ring, 2010-2018
Revenue and Net Income of Fulida, 2010-2018
Operating Revenue and Total Profit of Grace, 2010-2018
Viscose Fiber Capacity of Grace, 2019
Global and China Synthetic Rubber Industry Report, 2021-2027
Synthetic rubber is a polymer product made of coal, petroleum and natural gas as main raw materials and polymerized with dienes and olefins as monomers, which is typically divided into general synthet...
Global and China Carbon Fiber Industry Report, 2021-2026
Carbon fiber is a kind of inorganic high performance fiber (with carbon content higher than 90%) converted from organic fiber through heat treatment. As a new material with good mechanical properties,...
Global and China Dissolving Pulp Industry Report, 2019-2025
In 2018, global dissolving pulp capacity outstripped 10 million tons and its output surged by 14.0% from a year ago to 7.07 million tons, roughly 70% of the capacity. China, as a key supplier of disso...
Global and China 1, 4-butanediol (BDO) Industry Report, 2019-2025
1,4-butanediol (BDO), an essential organic and fine chemical material, finds wide application in pharmaceuticals, chemicals, textile and household chemicals.
As of the end of 2018, the global BDO cap...
Global and China Carbon Fiber and CFRP Industry Report, 2019-2025
Among the world’s three major high performance fibers, carbon fiber features the highest strength and the highest specific modulus. It is widely used in such fields as aerospace, sports and leisure.
...
Global and China Natural Rubber Industry Report, 2019-2025
In 2018, global natural rubber industry continued remained at low ebb, as a result of economic fundamentals. Global natural rubber price presented a choppy downtrend and repeatedly hit a record low in...
Global and China Ultra High Molecular Weight Polyethylene (UHMWPE) Industry Report, 2019-2025
Ultra high molecular weight polyethylene (UHMWPE), a kind of linear polyethylene with relative molecular weight of above 1.5 million used as an engineering thermoplastic with excellent comprehensive p...
China Polyether Monomer Industry Report, 2019-2025
China has seen real estate boom and issued a raft of policies for continuous efforts in improving weak links in infrastructure sector over the years. Financial funds of RMB1,663.2 billion should be al...
Global and China Viscose Fiber Industry Report, 2019-2025
Over the recent years, the developed countries like the United States, Japan and EU members have withdrawn from the viscose fiber industry due to environmental factor and so forth, while the viscose f...
Global and China Synthetic Rubber (BR, SBR, EPR, IIR, NBR, Butadiene, Styrene, Rubber Additive) Industry Report, 2018-2023
In 2018, China boasted a total synthetic rubber capacity of roughly 6,667kt/a, including 130kt/a new effective capacity. Considering capacity adjustment, China’s capacity of seven synthetic rubbers (B...
Global and China Dissolving Pulp Industry Report, 2018-2022
With the commissioning of new dissolving pulp projects, the global dissolving pulp capacity had been up to about 8,000 kt by the end of 2017. It is worth noticing that the top six producers including ...
Global and China Carbon Fiber and CFRP Industry Report, 2018-2022
As a new generation of reinforced fiber boasting intrinsic properties of carbon material and excellent processability of textile fiber, carbon fiber is the one with the highest specific strength and s...
Global and China Ultra High Molecular Weight Polyethylene (UHMWPE) Industry Report, 2017-2021
Ultra High Molecular Weight Polyethylene (UHMWPE), a kind of linear polyethylene with relative molecular weight of above 1.5 million and an engineering thermoplastic with excellent comprehensive prope...
Global and China Aramid Fiber Industry Report, 2017-2021
Global aramid fiber output totaled 115kt with capacity utilization of 76.0% in 2016. As industries like environmental protection and military develop, the output is expected to rise to 138kt and capac...
Global and China Natural Rubber Industry Report, 2017-2021
In 2016, the global natural rubber output edged up 1.1% year on year to 12.4 million tons, and the consumption rose by 3.8% year on year to 12.6 million tons, indicating the gap of 200,000 tons betwee...
China Synthetic Rubber Industry Report, 2017-2021
Synthetic rubber is one of important strategic materials, mainly used in tyres and other industries. In 2016, the global output and consumption of synthetic rubber reached 14.822 million tons and 14.9...
Global and China 1,4-butanediol (BDO) Industry Report, 2017-2021
1,4-butanediol (BDO) is a key raw material for organic and fine chemicals, capable of generating various derivatives like THF, PTMEG and GBL. BDO and its derivatives find wide application in PBT plast...
Global and China Ethylene Oxide (EO) Industry Report, 2017-2021
Ethylene oxide (EO) is one of the major derivatives of the ethylene industry. Featured with special reactivity, it can generate a series of fine chemical products for a wide range of applications.
In...