Global and China Natural Rubber Industry Report, 2019-2025
-
May 2019
- Hard Copy
- USD
$2,600
-
- Pages:128
- Single User License
(PDF Unprintable)
- USD
$2,400
-
- Code:
CYH085
- Enterprise-wide License
(PDF Printable & Editable)
- USD
$3,600
-
- Hard Copy + Single User License
- USD
$2,800
-
In 2018, global natural rubber industry continued remained at low ebb, as a result of economic fundamentals. Global natural rubber price presented a choppy downtrend and repeatedly hit a record low in recent two years, in spite of an uptick in the middle of 2018, which was not enough to invigorate the sluggish industry. By the end of 2018, the market still hovered at the bottom and showed no signs of recovery. In 2019, global natural rubber price will go on setting all-time lows until 2020 or 2021 when the price may level off and pick up.
In 2018, natural rubber was still in short supply globally, with a gap of around 120kt left to fill, due to China-US trade war, damage by plant diseases and insect pests and micro-economy factor. In the wake of steady growth in demand and insufficient production, the situation that supply falls short of demand will last for another five years before the gap can be narrowed.
China consumes the most natural rubber in the world, or 41% of global total, but its output occupies less than 6% of the total. Critical shortage leads to heavy dependence on imports. Yet in 2018 its imports stopped rising and declined by 7.1% to 2,600kt on an annualized basis, on account of trade tensions between China and the United States and less demand from terminal markets like car and heavy truck.
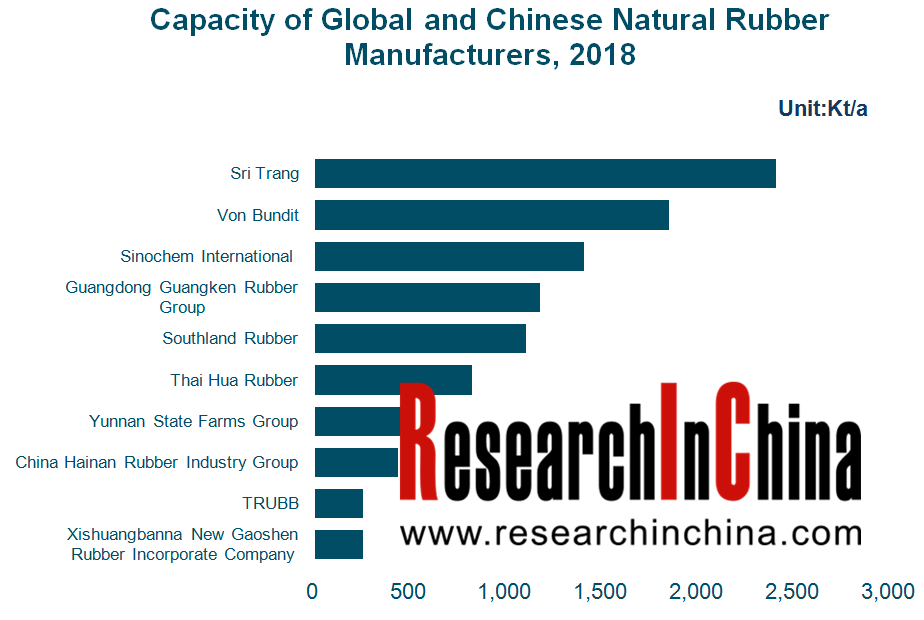
Global top six natural rubber producers including Sri Trang Agro-Industry, Vonbundit, Thai Hua Rubber Public, Thai Rubber Latex Corporation (Thailand) Public Co., Ltd. (TRUBB), Southland Rubber and Sinochem International Corporation, sit in the Southeast Asian countries such as Thailand and Singapore, because of climate and so forth. Among them, Sri Trang Agro-Industry is the largest player commanding roughly 12% of global market.
Chinese natural rubber producers are mostly large plantations and rubber corporations. Typical companies include Sinochem International Corporation, China Hainan Rubber Industry Group Co., Ltd., Guangdong Guangken Rubber Group Co., Ltd. and Yunnan State Farms Group Co., Ltd..
The report highlights the following:
 Supply & demand, regional distribution, prices, competitive landscape and development trends of global natural rubber market;
Supply & demand, import & export, regional structure, competitive landscape, development trends of Chinese natural rubber market;
Tapping area and planting area of natural rubber in China and around the world;
Development of applications of natural rubber in China, such as tyre, rubber belt & hose;
Operation and development in China of 5 global natural rubber companies;
Operation and development strategies of 5 key Chinese natural rubber companies.
1 Natural Rubber
1.1 Definition
1.2 Classification
1.3 Industry Chain
2 Global Natural Rubber Market
2.1 Status Quo
2.2 Supply
2.3 Demand
2.3.1 Consumption
2.3.2 Consumption Structure
2.4 Main Natural Rubber Producing Areas
2.4.1 Thailand
2.4.2 Indonesia
2.4.3 Malaysia
2.4.4 Vietnam
2.5 Price
2.6 Competitive Landscape
2.6.1 by Revenue
2.6.2 by Capacity
2.7 Development Trend
3 Chinese Natural Rubber Market
3.1 Status Quo
3.2 Supply and Demand
3.2.1 Supply and Regional Structure
3.2.2 Demand and Consumption Structure
3.3 Import and Export
3.3.1 Import
3.3.2 Export
3.4 Price
3.5 Competitive Landscape
3.5.1 by Enterprise
3.5.2 Substitute Products
3.6 Development Trend
4 Global and China Natural Rubber-related Industries
4.1 Upstream
4.2 Downstream
4.2.1 Tyre Industry
4.2.2 Others
5 Key Global Players
5.1 Sri Trang Agro-Industry Plc.
5.1.1 Profile
5.1.2 Operation
5.1.3 Capacity, Output and Sales Volume
5.1.4 Layout of Industry Chain
5.1.5 Development in China
5.1.6 Competitive Edge
5.2 Thai Rubber Latex Corporation (Thailand) Public Co., Ltd. (TRUBB)
5.2.1 Profile
5.2.2 Operation
5.2.3 Capacity and Sales Volume
5.2.4 Layout of Industry Chain
5.2.5 Product Strategy
5.2.6 Sales Channels
5.2.7 Development in China
5.3 Thai Hua Rubber Public Co., Ltd.
5.3.1 Profile
5.3.2 Capacity
5.3.3 Development in China
5.3.4 Competitive Edge
5.4 Von Bundit Co., Ltd.
5.4.1 Profile
5.4.2 Capacity
5.4.3 Competitive Edge
5.5 Southland Rubber Co., Ltd.
5.5.1 Profile
5.5.2 Capacity
5.5.3 Development in China
6 Major Chinese Companies
6.1 China Hainan Rubber Industry Group Co., Ltd. (601118)
6.1.1 Profile
6.1.2 Operation
6.1.3 Output and Sales Volume
6.1.4 Competitive Strength
6.1.5 Development Strategy
6.2 Sinochem International Corporation (600500)
6.2.1 Profile
6.2.2 Operation
6.2.3 Natural Rubber Business
6.2.4 Competitive Edge
6.3 Yunnan State Farms Group Co., Ltd.
6.3.1 Profile
6.3.2 Operation
6.3.3 Natural Rubber Business
6.3.4 Overseas Layout
6.3.5 Competitive Strength
6.4 Guangdong Guangken Rubber Group Co., Ltd.
6.4.1 Profile
6.4.2 Operation
6.4.3 Rubber Plantation Business
6.4.4 Rubber Processing Business
6.4.5 Development Strategy
6.5 Xishuangbanna New Gaoshen Rubber Incorporate Company
6.5.1 Profile
6.5.2 Operation
6.5.3 Capacity, Output and Sales Volume
Properties of Natural Rubber
Categories of Standard Rubber (by Level)
Classification of Natural Rubber
Main Production Processes of Natural Rubber
Natural Rubber Industry Chain
Development Stages of Natural Rubber in the World
Global Natural Rubber Output and YoY Growth, 2008-2018
Global Natural Rubber Output by Country, 2013-2018
Global ANRPC Natural Rubber Tapping Area, 2005-2018
Occurrence Time and Intensity of Severe El Nino Phenomena, by 2018
Global Natural Rubber Consumption and YoY Growth, 2008-2018
Global Natural Rubber Consumption Structure by Application, 2018
Global Natural Rubber Export Volume by Country, 2009-2018
Thailand's Natural Rubber Output, Export Volume, Consumption and Tapping Area, 2013-2025E
Thailand's Natural Rubber Output, 2009-2018
Thailand's Natural Rubber Output by Season, 2013-2018
Thailand's Natural Rubber Export Volume, 2012-2018
Thailand's Natural Rubber Export Volume Structure by Rubber Type, 2018
Thailand's Natural Latex Export Volume Structure by Country/Region, 2018
Thailand's Natural Rubber Cement Price, 2014-2018
Thailand's Cup Rubber Price, 2014-2018
Temperature Characteristics of Thailand's Natural Rubber Planting Areas by Month
Age Distribution of Thailand's Natural Rubber Trees, by 2020
Indonesia’s Natural Rubber Output, Consumption, Export Volume and Tapping Area, 2013-2025E
Indonesia’s Monthly Natural Rubber Output, 2009-2018
Indonesia’s Natural Rubber Export Volume, 2012-2018
Malaysia’s Natural Rubber Output, Consumption, Export Volume and Tapping Area, 2013-2025E
Malaysia’s Monthly Natural Rubber Output, 2009-2018
Malaysia’s Natural Rubber Export Volume, 2012-2018
Malaysia’s Natural Rubber Planting Area, Tapping Area and Tapping Rate, 2010-2018
Malaysia’s Additional Natural Rubber Planting Area, 2010-2018
Vietnam’s Natural Rubber Output, Consumption, Export Volume and Available Tapping Area, 2013-2025E
Vietnam’s Monthly Natural Rubber Output, 2009-2018
Vietnam’s Natural Rubber Planting Area, Tapping Area and Tapping Rate, 2010-2018
Vietnam’s Additional Natural Rubber Planting Area, 2010-2018
Age Distribution of Vietnam’s Natural Rubber Trees, by 2020
Policies about Natural Rubber in Major Countries, 2009-2018
Natural Rubber Price Trend in Tokyo Commodity Exchange, Singapore Mercantile Exchange and Shanghai Futures Exchange, 2013-2018
Revenue of Major Global and Chinese Rubber Producers, 2015-2018
Capacity of Major Global and Chinese Natural Rubber Producers, 2018
Global Natural Rubber Output and Consumption, 2015-2025E
Global Natural Rubber Consumption by Application, 2015-2025E
Purchase and Storage of Natural Rubber in China, as of the end of Jul 2018
China’s Natural Rubber Output and YoY Growth, 2008-2018
China’s Natural Rubber Self-sufficiency Rate, 2005-2018
China’s Natural Rubber Output Structure by Region, 2018
Structure of Hainan's Natural Rubber Processing Regions
China’s Natural Rubber Consumption and YoY Growth, 2008-2018
China’s Natural Rubber Consumption Structure, 2013-2025E
China’s Import Tariff Policy on Natural Rubber, 2006-2018
Import Volume and YoY Growth of Natural Rubber in China, 2007-2018
Import Volume Structure of Natural Rubber in China by Country, 2007-2018
Import Volume Structure of Natural Rubber in China by Product, 2013-2018
China’s Natural Rubber Export Volume, 2008-2018
Main Factors Influencing China’s Natural Rubber Price, 2018
China’s Natural Rubber Price, 2011-2018
Natural Latex Prices in China, 2015-2019 (RMB/ton)
Natural Rubber Cement Price in Yunnan, 2014-2018
Natural Rubber Business Development of Major Natural Rubber Producers in China, 2018
Performance of Common Rubber Products
China’s Synthetic Rubber Output and Consumption, 2011-2025E
China’s Natural Rubber Output and Consumption, 2015-2025E
Total Planting Area of Global Top 9 Natural Rubber Producing Countries, 2008-2018
Tapping Area of Global Top 9 Natural Rubber Producing Countries, 2004-2018
New Planting & Replanting Area of Global Major Natural Rubber Producing Countries, 2008-2018
Stoppage Periods of Global Major Natural Rubber Producing Countries
China’s All-Steel Tire & Semisteel Tire Operating Rate, 2015-2018
China’s Tire Export Volume and Value, 2013-2018
All-Steel Tire Cost Structure by Raw Materials, 2018
Semisteel Tire Cost Structure by Raw Materials, 2018
Demand of Chinese Radial Tires for Natural Rubber, 2015-2025E
Overseas Natural Rubber Layout of Chinese Tire Enterprises, 2018
China’s Rubber Hose & Belt Output and YoY Growth, 2012-2025E
Revenue and YoY Growth of Rubber Hose-related Manufacturers in China, 2008-2018
Milestones in the Development of Sri Trang, 1987-2018
Revenue and Net Income of Sri Trang, 2008-2018
Gross Profit and Gross Margin of Sri Trang, 2014-2018
Operating Revenue of Sri Trang by Product, 2012-2018
Revenue Structure of Sri Trang by Product, 2018
Natural Rubber Operating Revenue of Sri Trang by Country/Region, 2013-2018
Natural Rubber Sales Volume of Sri Trang by Product, 2010-2018
Sales Volume of Sri Trang by Country/Region, 2014-2018
Quarterly Sales Volume of Sri Trang by Region, 2016-2018
Sales Volume Structure of Sri Trang by Region, 2018
Natural Rubber Industry Chain of Sri Trang, 2018
Natural Rubber Planting Area Structure of Sri Trang, by the end of 2018
Available Natural Rubber Tapping Area of Sri Trang, 2016-2025E
Natural Rubber Processing Plants and Capacity of Sri Trang by Product, by the end of 2018
Natural Rubber Capacity of Sri Trang, 2007-2018
Layout of Sri Trang in Main Downstream Natural Rubber Products, 2018
Splitting and Restructuring between Sri Trang and STP
Natural Rubber Revenue of Sri Trang in China, 2011-2018
Sri Trang’s Sales in China as a Percentage of China’s Total Natural Rubber Import Volume, 2012-2018
Global Market Share of Sri Trang, 2018
Main Development Strategies of Sri Trang
Revenue and Net Income of TRUBB, 2008-2018
Subsidiaries of TRUBB by Business, 2018
Revenue Structure of TRUBB by Business, 2013-2018
Revenue Structure of TRUBB by Region, 2015-2018
Capacity of TRUBB by Business, 2013-2018
Sales Volume of TRUBB by Business, 2012-2013
Natural Rubber Industry Chain of TRUBB, 2018
Competitive Strategies of TRUBB’s Main Products
Sales Channels of TRUBB's Main Business Divisions, 2018
TRUBB’s Revenue in China, 2012-2018
Factories and Capacity of Thai Hua, 2018
Natural Rubber Capacity of Thai Hua by Product, 2018
Distribution of Von Bundit’s Affiliated Companies, 2018
Capacity of Von Bundit by Product, 2013-2018
Natural Rubber Capacity of Von Bundit by Factory, 2018
Global Development Events of Southland Rubber, 1999-2018
Capacity of Southland Rubber by Product, 2015-2018
Capacity of Southland Rubber by Factory, 2018
Factory Distribution of Southland Rubber by Product
Revenue and Net Income of Hainan Rubber Group, 2008-2018
Operating Revenue Structure of Hainan Rubber Group by Product, 2012-2018
Operating Revenue of Hainan Rubber Group by Region, 2009-2018
Gross Margin of Hainan Rubber Group by Product, 2009-2018
Natural Rubber Output of Hainan Rubber Group by Channel, 2010-2018
Sales Volume and YoY Growth of Hainan Rubber Group, 2008-2018
Industry Chain Layout of Hainan Rubber Group, 2018
New Planting Area of Hainan Rubber Group’s Special Rubber Plantations, 2016-2020E
Supporting Shelterbelt Area of Hainan Rubber Group’s Special Rubber Plantations, 2016-2020E
Revenue and Net Income of Sinochem International, 2008-2018
Operating Revenue of Sinochem International by Business, 2015-2018
Revenue of Sinochem International by Region, 2012-2018
Gross Margin of Sinochem International by Business, 2009-2018
Natural Rubber Revenue and Operating Cost of Sinochem International, 2009-2018
Natural Rubber Capacity of Sinochem International, 2010-2018
Natural Rubber Output and Sales Volume of Sinochem International, 2011-2018
Revenue and Net Income of Yunnan State Farms Group, 2012-2018
Operating Revenue Structure of Yunnan State Farms Group by Business, 2014-2018
Natural Rubber Planting Area, Tapping Area and Tapping Rate of Yunnan State Farms Group, 2012-2018
Fresh Rubber Cement Procurement of Yunnan State Farms Group, 2014-2018
Natural Rubber Capacity and Output of Yunnan State Farms Group by Product, 2012-2018
Natural Rubber Revenue Structure of Yunnan State Farms Group by Product, 2012-2018
Natural Rubber Sales Volume and Structure of Yunnan State Farms Group by Sales Channel, 2012-2018
Major Overseas Subsidiaries of Guangdong Guangken Rubber Group
Revenue and YoY Growth of Rubber Companies of Guangdong Guangken Rubber Group, 2010-2018
Natural Rubber Revenue of Guangdong Guangken Rubber Group by Region, 2013-2018
Natural Rubber Procurement and Price of Guangdong Guangken Rubber Group by Region, 2013-2018
Rubber Capacity and Output of Guangdong Guangken Rubber Group by Product, 2013-2018
Sales Volume and Revenue of Rubber Companies of Guangdong Guangken Rubber Group by Product/Region, 2013-2018
Major Rubber Projects Planned/under Construction of Guangdong Guangken Rubber Group, by the end of 2018
Revenue and Net Income of Xishuangbanna New Gaoshen Rubber, 2013-2018
Operating Revenue Structure of Xishuangbanna New Gaoshen Rubber by Region, 2013-2018
Capacity and Output of Xishuangbanna New Gaoshen Rubber by Factory, 2013-2018
Global and China Synthetic Rubber Industry Report, 2021-2027
Synthetic rubber is a polymer product made of coal, petroleum and natural gas as main raw materials and polymerized with dienes and olefins as monomers, which is typically divided into general synthet...
Global and China Carbon Fiber Industry Report, 2021-2026
Carbon fiber is a kind of inorganic high performance fiber (with carbon content higher than 90%) converted from organic fiber through heat treatment. As a new material with good mechanical properties,...
Global and China Dissolving Pulp Industry Report, 2019-2025
In 2018, global dissolving pulp capacity outstripped 10 million tons and its output surged by 14.0% from a year ago to 7.07 million tons, roughly 70% of the capacity. China, as a key supplier of disso...
Global and China 1, 4-butanediol (BDO) Industry Report, 2019-2025
1,4-butanediol (BDO), an essential organic and fine chemical material, finds wide application in pharmaceuticals, chemicals, textile and household chemicals.
As of the end of 2018, the global BDO cap...
Global and China Carbon Fiber and CFRP Industry Report, 2019-2025
Among the world’s three major high performance fibers, carbon fiber features the highest strength and the highest specific modulus. It is widely used in such fields as aerospace, sports and leisure.
...
Global and China Natural Rubber Industry Report, 2019-2025
In 2018, global natural rubber industry continued remained at low ebb, as a result of economic fundamentals. Global natural rubber price presented a choppy downtrend and repeatedly hit a record low in...
Global and China Ultra High Molecular Weight Polyethylene (UHMWPE) Industry Report, 2019-2025
Ultra high molecular weight polyethylene (UHMWPE), a kind of linear polyethylene with relative molecular weight of above 1.5 million used as an engineering thermoplastic with excellent comprehensive p...
China Polyether Monomer Industry Report, 2019-2025
China has seen real estate boom and issued a raft of policies for continuous efforts in improving weak links in infrastructure sector over the years. Financial funds of RMB1,663.2 billion should be al...
Global and China Viscose Fiber Industry Report, 2019-2025
Over the recent years, the developed countries like the United States, Japan and EU members have withdrawn from the viscose fiber industry due to environmental factor and so forth, while the viscose f...
Global and China Synthetic Rubber (BR, SBR, EPR, IIR, NBR, Butadiene, Styrene, Rubber Additive) Industry Report, 2018-2023
In 2018, China boasted a total synthetic rubber capacity of roughly 6,667kt/a, including 130kt/a new effective capacity. Considering capacity adjustment, China’s capacity of seven synthetic rubbers (B...
Global and China Dissolving Pulp Industry Report, 2018-2022
With the commissioning of new dissolving pulp projects, the global dissolving pulp capacity had been up to about 8,000 kt by the end of 2017. It is worth noticing that the top six producers including ...
Global and China Carbon Fiber and CFRP Industry Report, 2018-2022
As a new generation of reinforced fiber boasting intrinsic properties of carbon material and excellent processability of textile fiber, carbon fiber is the one with the highest specific strength and s...
Global and China Ultra High Molecular Weight Polyethylene (UHMWPE) Industry Report, 2017-2021
Ultra High Molecular Weight Polyethylene (UHMWPE), a kind of linear polyethylene with relative molecular weight of above 1.5 million and an engineering thermoplastic with excellent comprehensive prope...
Global and China Aramid Fiber Industry Report, 2017-2021
Global aramid fiber output totaled 115kt with capacity utilization of 76.0% in 2016. As industries like environmental protection and military develop, the output is expected to rise to 138kt and capac...
Global and China Natural Rubber Industry Report, 2017-2021
In 2016, the global natural rubber output edged up 1.1% year on year to 12.4 million tons, and the consumption rose by 3.8% year on year to 12.6 million tons, indicating the gap of 200,000 tons betwee...
China Synthetic Rubber Industry Report, 2017-2021
Synthetic rubber is one of important strategic materials, mainly used in tyres and other industries. In 2016, the global output and consumption of synthetic rubber reached 14.822 million tons and 14.9...
Global and China 1,4-butanediol (BDO) Industry Report, 2017-2021
1,4-butanediol (BDO) is a key raw material for organic and fine chemicals, capable of generating various derivatives like THF, PTMEG and GBL. BDO and its derivatives find wide application in PBT plast...
Global and China Ethylene Oxide (EO) Industry Report, 2017-2021
Ethylene oxide (EO) is one of the major derivatives of the ethylene industry. Featured with special reactivity, it can generate a series of fine chemical products for a wide range of applications.
In...