Global and China Dissolving Pulp Industry Report, 2019-2025
-
Sep.2019
- Hard Copy
- USD
$3,000
-
- Pages:103
- Single User License
(PDF Unprintable)
- USD
$2,800
-
- Code:
ZHP100
- Enterprise-wide License
(PDF Printable & Editable)
- USD
$4,200
-
- Hard Copy + Single User License
- USD
$3,200
-
In 2018, global dissolving pulp capacity outstripped 10 million tons and its output surged by 14.0% from a year ago to 7.07 million tons, roughly 70% of the capacity. China, as a key supplier of dissolving pulp, produced 1.56 million tons (a 22.1% share of global total) in 2018, 2.5% less than in the previous year, with output showing a CAGR of 4.8% from 2012 to 2018.
China’s dissolving pulp market in 2018/2019 is featured as follows:
By product segment: wood pulp output sustained growth, while cotton and bamboo pulp and modified pulp kept falling in output. In 2018, 1.07 million tons of wood pulp, or 68.6% of China’s total dissolving pulp output, was produced, up by 1.9% on an annualized basis; output of cotton & bamboo pulp and modified pulp reduced by 8.6% and 15.0%, respectively.
By price: due to China-US trade tensions (China imposed additional tariffs of 5% on dissolving pulp originating from the United States; China and the United States placed additional 25% tariffs on viscose staple fiber originating from each other), Chinese dissolving pulp (wood pulp) price has presented a choppy downtrend since the second half of 2018, nose-diving to around RMB6,500/ton in the first half of 2019, compared with over RMB7,500/ton in 2018.
By application: viscose staple fiber uses the most dissolving pulp. China’s output of viscose staple fiber jumped by 7.6% over the previous year to virtually 3.95 million tons in 2018, showing a CAGR of 11.6% between 2008 and 2018. The continued expansion of viscose staple fiber capacity and the release of downstream cellulose fiber capacity in the forthcoming years, will favor solid growth in viscose staple fiber output of the country.
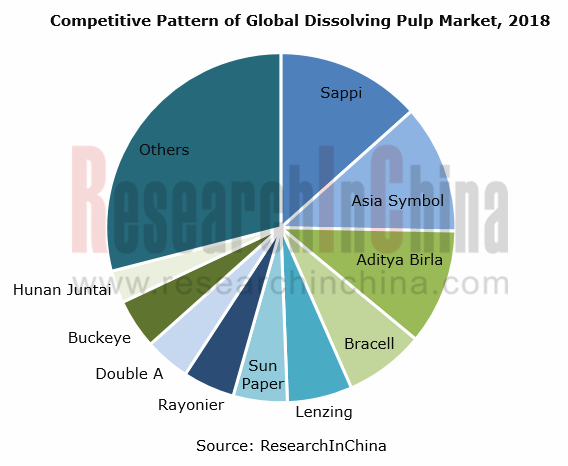
By competitive pattern: globally, key dissolving pulp producers are Sappi (South Africa), Bracell (Brazil), Lenzing (Australia), and some Chinese companies like Shandong Sun Paper Industry Joint Stock Co., Ltd., Asia Symbol (Shandong) Pulp & Paper Co., Ltd., Hunan Juntai New Material Technology Co., Ltd. and Fujian Qingshan Paper Industry Co., Ltd.. In 2018, global CR10 exceeded 70%, among which Sappi came to the top spot with a 13.4% share in the global market. As the biggest Chinese producer of dissolving pulp, Shandong Sun Paper Industry Joint Stock Co., Ltd. which swept 19.2% shares in the Chinese market in 2018, occupies 5.0% of the global market.
Global and China Dissolving Pulp Industry Report, 2019-2025 highlights the following:
 Dissolving pulp (definition, classification, industry chain, etc.);
Global dissolving pulp market (status quo, competitive pattern, and price);
China dissolving pulp market (status quo, supply, demand, price, import, competitive pattern, etc.);
Downstream viscose staple fiber market (status quo, capacity, output, import and export, price, etc.);
5 global and 9 Chinese dissolving pulp producers (operation, revenue structure, dissolving pulp business, etc.).
1. Overview of Dissolving Pulp Industry
1.1 Definition & Classification
1.2 Industrial Chain
2. Global Dissolving Pulp Industry
2.1 Status Quo
2.2 Competitive Landscape
2.3 Price Analysis
3. China Dissolving Pulp Industry
3.1 Status Quo
3.2 Anti-dumping Investigation
3.3 Supply
3.4 Demand
3.5 Price Analysis
3.6 Import
3.7 Competitive Landscape
4. Downstream Viscose Fiber Market
4.1 Overview
4.2 Capacity
4.3 Output
4.4 Import & Export
4.4.1 Import & Export Volume
4.4.2 Import & Export Country
4.4.3 Import & Export Region
4.5 Price Analysis
5. Major Dissolving Pulp Companies Worldwide
5.1 Bracell
5.1.1 Profile
5.1.2 Operation
5.1.3 Dissolving Pulp Business
5.1.4 Business in China
5.2 Sappi
5.2.1 Profile
5.2.2 Operation
5.2.3 Revenue Structure
5.2.4 Dissolving Pulp Business
5.2.5 Business in China
5.3 Aditya Birla Group
5.3.1 Profile
5.3.2 Operation of Grasim
5.3.3 Revenue Structure of Grasim
5.3.4 Dissolving Pulp Business of Grasim
5.3.5 Business in China
5.4 Lenzing
5.4.1 Profile
5.4.2 Operation
5.4.3 Revenue Structure
5.4.4 Operation of Fiber Segment
5.4.5 Dissolving Pulp Business
5.4.6 Business in China
5.5 Rayonier AM
5.5.1 Profile
5.5.2 Operation
5.5.3 Dissolving Pulp Business
6. Major Chinese Dissolving Pulp Companies
6.1 Shandong Sun Paper Industry Joint Stock Co., Ltd.
6.1.1 Profile
6.1.2 Operation
6.1.3 Revenue Structure
6.1.4 Gross Margin
6.1.5 R&D
6.1.6 Dissolving Pulp Business
6.1.7 Forecast and Outlook
6.2 Fujian Qingshan Paper Industry Co., Ltd.
6.2.1 Profile
6.2.2 Operation
6.2.3 Revenue Structure
6.2.4 Gross Margin
6.2.5 R&D
6.2.6 Dissolving Pulp Business
6.2.7 Forecast and Outlook
6.3 Yueyang Forest & Paper Co., Ltd.
6.3.1 Profile
6.3.2 Operation
6.3.3 Revenue Structure
6.3.4 Gross Margin
6.3.5 R&D
6.3.6 Dissolving Pulp Business
6.3.7 Forecast and Outlook
6.4 Shandong Chenming Paper Holdings Ltd.
6.4.1 Profile
6.4.2 Operation
6.4.3 Revenue Structure
6.4.4 Gross Margin
6.4.5 R&D
6.4.6 Dissolving Pulp Business
6.4.7 Forecast and Outlook
6.5 Shandong Huatai Paper Co., Ltd.
6.5.1 Profile
6.5.2 Operation
6.5.3 Revenue Structure
6.5.4 Gross Margin
6.5.5 R&D
6.5.6 Dissolving Pulp Business
6.5.7 Forecast and Outlook
6.6 Yanbian Shixian Double-deer Industrial Co., Ltd.
6.6.1 Profile
6.6.2 Dissolving Pulp Business
6.7 Yibin Grace Group Co., Ltd.
6.7.1 Profile
6.7.2 Dissolving Pulp Business
6.8 Sichuan Tianzhu Bamboo Resource Development Co., Ltd.
6.9 Asia Symbol (Shandong) Pulp & Paper Co., Ltd.
7. Conclusion & Prediction
7.1 Conclusion
7.2 Prediction
7.2.1 Supply & Demand Prediction
7.2.2 Downstream Forecast
Classification of Dissolving Pulp (by Raw Materials)
Industrial Chain of Dissolving Pulp
Other Downstream Products and Applications of Dissolving Pulp
Dissolving Pulp Capacity Distribution Worldwide, 2018
Major Global Dissolving Pulp Manufacturers and Their Capacity, 2018
Capacity Structure of Major Global Dissolving Pulp Manufacturers, 2018
Key Dissolving Pulp Projects Planned/Under Construction Worldwide, 2019
Trend of Dissolving Pulp Prices Worldwide (Unit: USD/ton), 2016-2019
China's Anti-dumping Investigation on Pulp from USA, Canada and Brazil
Dissolving Pulp Capacity in China, 2010-2019
Dissolving Pulp Output in China (by Product), 2012-2018
Output Structure of Dissolving Pulp in China (by Product), 2012-2019
Apparent Consumption of Dissolving Pulp in China, 2012-2019
Price Trend of Viscose Staple Fiber and Dissolving Pulp in China, 2016-2018
Price Trend of Dissolving Pulp in China, 2018
Dissolving Wood Pulp Price in China, 2018-2019
Dissolving Pulp Import in China, 2010-2019
Average Import Price of Dissolving Pulp in China, 2010-2019
Imported Dissolving Wood Pulp Price in China, 2018
Dissolving Wood Pulp Import Structure in China by Region, 2018
Major Dissolving Pulp Manufacturers in China and Their Capacity, 2018
Capacity Structure of Dissolving Pulp Manufacturers in China, 2018
Major Varieties of Fiber Worldwide
Global Viscose Fiber Market Size, 2017-2023E
Viscose Fiber Market Size in China, 2017-2023E
Fiber Consumption Structure Worldwide, 2015
Fiber Consumption Structure Worldwide, 2018
Major Viscose Staple Fiber Manufacturers in China and Their Capacity, 2018
Distribution of Viscose Staple Fiber Capacity in China, 2018
Distribution of Viscose Staple Fiber Capacity in China by Region, 2018
Viscose Fiber Output and YoY Growth in China, 2008-2019
Viscose Staple Fiber’s Demand for Dissolving Pulp in China, 2014-2018
Viscose Staple Fiber Imports/Exports in China, 2010-2019
Average Import/Export Prices of Viscose Staple Fiber in China, 2010-2019
Destinations of Exported Viscose Staple Fiber from China by Export Volume, 2018
Sources of Imported Viscose Staple Fiber in China by Import Volume, 2018
Major Viscose Staple Fiber Export Cities and Their Export Volume in China (%), 2018
Major Viscose Staple Fiber Import Cities and Their Import Volume in China (%), 2018
Market Prices of Viscose Staple Fiber and Viscose Filament Yarn in China, 2008-2015
Market Prices of Viscose Staple Fiber in China, 2004-2017
Price Trend of Viscose Staple Fiber in China, 2019
Product Line and Applications of Bracell
Revenue and Net Income of Bracell, 2010-2017
Varieties and Applications of Bracell’s Dissolving Wood Pulp
Sales Volume of Viscose Pulp and Its Percentage of Bracell, 2013-2018
Bracel’s Shipments by Product, 2017
Bracel’s Shipment Structure by Region, 2017
Sales Volume of Specialty Pulp and Its % of Bracell’s Dissolving Wood Pulp Sales, 2013-2016
Capacity of Sappi's Major Products
Sappi’s Three Major Production Bases and Capacity of Major Products, as of the end of 2018
Revenue and EBITDA of Sappi, 2010-2019
Revenue Breakdown (by Branches) of Sappi, 2012-2018
Revenue Structure (by Branches) of Sappi, 2012-2018
Sales Volume of Sappi by Product, 2014-2018
Dissolving Pulp Manufacturing Plants and Capacity of Sappi, 2018
Sales Volume of Dissolving Wood Pulp of Sappi, 2012-2018
Revenue and EBITDA of Grasim, FY 2014-FY2019
Revenue Structure (by Product) of Grasim, FY2014-FY2019
Revenue Structure (by Product) of Grasim, FY2019
Production and Sales Volume of Grasim, FY2014-FY2019
Grasim's Capacity of Viscose Staple Fiber and Dissolving Pulp, FY2019
Employee Structure of Lenzing by Country, 2018
Revenue and EBITDA of Lenzing, 2010-2019
Revenue Structure (by Product) of Lenzing, 2012-2019
Revenue Structure (by Region) of Lenzing, 2012-2019
Revenue and EBITDA of Lenzing’s Fiber Division, 2010-2019
Revenue Breakdown (by Product) of Lenzing’s Fiber Division, 2012-2019
Revenue Structure (by Product) of Lenzing’s Fiber Division, 2012-2019
Major Production Bases of Dissolving Pulp and Their Capacities of Lenzing, as of the end of 2017
Revenue and Net Income of Lenzing (Nanjing) Fiber Co., Ltd., 2010-2019
Major Products of Rayonier AM
Revenue and Net Income of Rayonier AM, 2013-2019
Revenue of Rayonier AM (by Product), 2015-2019
Revenue from High Purity Cellulose of Rayonier AM, 2015-2019
Revenue and Net Income of Shandong Sun Paper, 2011-2019
Revenue Breakdown (by Product) of Shandong Sun Paper, 2014-2019
Revenue Structure (by Product) of Shandong Sun Paper, 2014-2019
Revenue Breakdown (by Region) of Shandong Sun Paper, 2013-2019
Revenue Structure (by Region) of Shandong Sun Paper, 2013-2019
Gross Margin (by Product) of Shandong Sun Paper, 2014-2019
R&D Investment and % of Total Revenue of Shandong Sun Paper, 2014-2019
Revenue from Dissolving Pulp and its % of Total Revenue of Shandong Sun Paper, 2014-2019
Revenue and Net Income of Shandong Sun Paper, 2019-2025E
Revenue and Net Income of Fujian Qingshan Paper Industry, 2010-2019
Revenue Breakdown (by Product) of Fujian Qingshan Paper Industry, 2012-2018
Revenue Structure (by Product) of Fujian Qingshan Paper Industry, 2012-2018
Gross Margin of Fujian Qingshan Paper Industry, 2012-2018
Gross Margin of Major Products of Fujian Qingshan Paper Industry, 2012-2018
R&D Investment and % of Total Revenue of Fujian Qingshan Paper Industry, 2012-2018
Progress of Major Investment Projects of Fujian Qingshan Paper Industry, as of 2019H1
Output and Sales Volume of Paper Pulp of Fujian Qingshan Paper Industry, 2015-2018
Revenue and Net Income of Fujian Qingshan Paper Industry, 2019-2025E
Revenue and Net Income of Yueyang Forest & Paper, 2010-2019
Revenue Breakdown (by Product) of Yueyang Forest & Paper, 2014-2018
Revenue Structure (by Product) of Yueyang Forest & Paper, 2014-2018
Gross Margin of Major Products of Yueyang Forest & Paper, 2014-2018
R&D Investment and % of Total Revenue of Yueyang Forest & Paper, 2013-2018
Revenue and Net Income of Yueyang Forest & Paper, 2019-2025E
Revenue and Net Income of Shandong Chenming Paper, 2010-2019
Revenue Breakdown (by Product) of Shandong Chenming Paper, 2012-2019
Revenue Structure (by Product) of Shandong Chenming Paper, 2012-2019
Revenue Breakdown (by Region) of Shandong Chenming Paper, 2012-2019
Revenue Structure (by Region) of Shandong Chenming Paper, 2012-2019
Gross Margin of Major Products of Shandong Chenming Paper, 2012-2018
R&D Investment and % of Total Revenue of Shandong Chenming Paper, 2013-2019
Progress of Dissolving Pulp Projects under Construction of Shandong Chenming Paper, as of 2019H1
Revenue and Net Income of Shandong Chenming Paper, 2019-2025E
Revenue and Net Income of Shandong Huatai Paper, 2010-2019
Revenue Breakdown (by Product) of Shandong Huatai Paper, 2012-2019
Revenue Structure (by Product) of Shandong Huatai Paper, 2012-2019
Gross Margin of Major Products of Shandong Huatai Paper, 2012-2019
R&D Investment and % of Total Revenue of Shandong Huatai Paper, 2013-2019
Revenue and Net Income of Anhui Huatai, 2012-2019
Revenue and Net Income of Shandong Huatai Paper, 2019-2025E
Specification of Major Wood Pulp Products of Yanbian Shixian
Capacity of Major Products of Yibin Grace Group, 2018
Comparison between Global and Chinese Dissolving Pulp Manufacturers in Operation, 2014-2018
Global Major Dissolving Pulp Projects Planned/Under Construction, 2018
Output and Apparent Consumption of Dissolving Pulp in China, 2018-2025E
Dissolving Pulp Import Dependence in China, 2018-2025E
Viscose Fiber Projects under Construction in China, by the end of 2018
Output and YoY Growth of Viscose Fiber in China, 2018-2025E
Global and China Synthetic Rubber Industry Report, 2021-2027
Synthetic rubber is a polymer product made of coal, petroleum and natural gas as main raw materials and polymerized with dienes and olefins as monomers, which is typically divided into general synthet...
Global and China Carbon Fiber Industry Report, 2021-2026
Carbon fiber is a kind of inorganic high performance fiber (with carbon content higher than 90%) converted from organic fiber through heat treatment. As a new material with good mechanical properties,...
Global and China Dissolving Pulp Industry Report, 2019-2025
In 2018, global dissolving pulp capacity outstripped 10 million tons and its output surged by 14.0% from a year ago to 7.07 million tons, roughly 70% of the capacity. China, as a key supplier of disso...
Global and China 1, 4-butanediol (BDO) Industry Report, 2019-2025
1,4-butanediol (BDO), an essential organic and fine chemical material, finds wide application in pharmaceuticals, chemicals, textile and household chemicals.
As of the end of 2018, the global BDO cap...
Global and China Carbon Fiber and CFRP Industry Report, 2019-2025
Among the world’s three major high performance fibers, carbon fiber features the highest strength and the highest specific modulus. It is widely used in such fields as aerospace, sports and leisure.
...
Global and China Natural Rubber Industry Report, 2019-2025
In 2018, global natural rubber industry continued remained at low ebb, as a result of economic fundamentals. Global natural rubber price presented a choppy downtrend and repeatedly hit a record low in...
Global and China Ultra High Molecular Weight Polyethylene (UHMWPE) Industry Report, 2019-2025
Ultra high molecular weight polyethylene (UHMWPE), a kind of linear polyethylene with relative molecular weight of above 1.5 million used as an engineering thermoplastic with excellent comprehensive p...
China Polyether Monomer Industry Report, 2019-2025
China has seen real estate boom and issued a raft of policies for continuous efforts in improving weak links in infrastructure sector over the years. Financial funds of RMB1,663.2 billion should be al...
Global and China Viscose Fiber Industry Report, 2019-2025
Over the recent years, the developed countries like the United States, Japan and EU members have withdrawn from the viscose fiber industry due to environmental factor and so forth, while the viscose f...
Global and China Synthetic Rubber (BR, SBR, EPR, IIR, NBR, Butadiene, Styrene, Rubber Additive) Industry Report, 2018-2023
In 2018, China boasted a total synthetic rubber capacity of roughly 6,667kt/a, including 130kt/a new effective capacity. Considering capacity adjustment, China’s capacity of seven synthetic rubbers (B...
Global and China Dissolving Pulp Industry Report, 2018-2022
With the commissioning of new dissolving pulp projects, the global dissolving pulp capacity had been up to about 8,000 kt by the end of 2017. It is worth noticing that the top six producers including ...
Global and China Carbon Fiber and CFRP Industry Report, 2018-2022
As a new generation of reinforced fiber boasting intrinsic properties of carbon material and excellent processability of textile fiber, carbon fiber is the one with the highest specific strength and s...
Global and China Ultra High Molecular Weight Polyethylene (UHMWPE) Industry Report, 2017-2021
Ultra High Molecular Weight Polyethylene (UHMWPE), a kind of linear polyethylene with relative molecular weight of above 1.5 million and an engineering thermoplastic with excellent comprehensive prope...
Global and China Aramid Fiber Industry Report, 2017-2021
Global aramid fiber output totaled 115kt with capacity utilization of 76.0% in 2016. As industries like environmental protection and military develop, the output is expected to rise to 138kt and capac...
Global and China Natural Rubber Industry Report, 2017-2021
In 2016, the global natural rubber output edged up 1.1% year on year to 12.4 million tons, and the consumption rose by 3.8% year on year to 12.6 million tons, indicating the gap of 200,000 tons betwee...
China Synthetic Rubber Industry Report, 2017-2021
Synthetic rubber is one of important strategic materials, mainly used in tyres and other industries. In 2016, the global output and consumption of synthetic rubber reached 14.822 million tons and 14.9...
Global and China 1,4-butanediol (BDO) Industry Report, 2017-2021
1,4-butanediol (BDO) is a key raw material for organic and fine chemicals, capable of generating various derivatives like THF, PTMEG and GBL. BDO and its derivatives find wide application in PBT plast...
Global and China Ethylene Oxide (EO) Industry Report, 2017-2021
Ethylene oxide (EO) is one of the major derivatives of the ethylene industry. Featured with special reactivity, it can generate a series of fine chemical products for a wide range of applications.
In...