China Structural Adhesive Industry Report, 2012-2015
-
Apr.2013
- Hard Copy
- USD
$2,150
-
- Pages:88
- Single User License
(PDF Unprintable)
- USD
$2,050
-
- Code:
ZYM042
- Enterprise-wide License
(PDF Printable & Editable)
- USD
$3,200
-
- Hard Copy + Single User License
- USD
$2,350
-
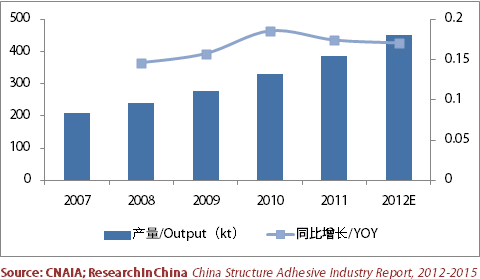
Structure adhesive is a kind of high value-added adhesive with higher technical content and higher conditions for production and application than average adhesives. In 2007-2011, China’s output of structure adhesive presented a CAGR of 16.6%, higher than the growth rate of 13.6% of the adhesive industry in the same period. In 2012, China had a total of nearly 300 professional structure adhesive manufacturers with the output rising by 19.6% year-on-year to 453,000 tons. In particular, silicone adhesive, epoxy adhesive and PU adhesive were the three that enjoyed highest output, with the combined proportion as high as 90% or more.
Driven by the robust demand from downstream building, wind power and automotive manufacturing sectors as well as the advances in industrial technology, China-made structure adhesives, especially top-grade special adhesives with silicone adhesive, epoxy adhesive and PU adhesive as base materials, are expected to see an AAGR of 15%-20% when it comes to output.
China’s Output of Structure Adhesive and YoY Growth Rate, 2007-2012
?
At the early stage, the development of Chinese structure adhesive industry was heavily reliant on the introduction of overseas technologies and was long monopolized by foreign brands such as Fuller, Henkel, Momentive, 3M and Sika. However, after several decades of years of development, domestic players including Huitian Adhesive, Shanghai KangDa New Materials, Chengdu Guibao Science & Technology and TONSAN Adhesive have been provided with competitive technological R&D and independent innovation capabilities, seizing considerable share in some market segments. A case in point is Huitian Adhesive, which is one of major suppliers in automotive adhesive field with the revenue in 2012 hitting RMB226 million. Another case is Shanghai KangDa New Materials, which is leader in wind power epoxy adhesive industry of China with the market share in 2012 high up to 41%.
In addition, given the great confidence in Chinese market and business strategies, international tycoons like Henkel continue their hefty investment in China. In early 2011, Henkel launched the world’s largest adhesive plant project-“Long Project” which was conducted in three phases. Elaborately, the first phase of 270,000 tons/a industrial adhesive and metal surface treatment agent project is estimated to be put into production in mid-2013; the second phase of 140,000 tons/a automotive, general industry and adhesive for civilian use is expected to be finished in 2014H1 after the environmental assessment result was published in Aug.2012.
The report highlights the followings: 
?Operating environment, status quo, competition pattern, demand & supply, import & export and prospect of China structure adhesive industry;
Status quo, demand & supply and development outlook of China structure adhesive market segments such as silicone, epoxy and PU adhesives.
Operation, adhesive business and prospects of 8 international and 9 Chinese structure adhesive companies.
1. Overview of Structural Adhesive
1.1 Definition and Classification of Adhesives
1.2 Definition and Classification of Structural Adhesive
2. China Structural Adhesive Market
2.1 Operating Environment
2.1.1 Global Market Environment
2.1.2 China Policy Environment
2.2 Overall Status Quo
2.3 Demand & Supply
2.3.1 Supply
2.3.2 Demand
2.4 Competition Pattern
2.5 Import & Export
2.5.1 Export
2.5.2 Import
2.6 Structure Adhesive Downstream
2.6.1 Building Field
2.6.2 Automotive Field
2.6.3 Wind Power & PV Fields
2.6.4 Electronic & Electric Field
2.6.5 Other Fields
2.7 Development Trend
3. China Structure Adhesive Market Segments
3.1 Silicone Structure Adhesive
3.2 Epoxy Structure Adhesive
3.3 PU Structure Adhesive
3.4 Acrylate Structure Adhesive & Others
4. Global Major Suppliers
4.1 H.B. FULLER
4.1.1 Profile
4.1.2 Operation
4.1.3 Revenue Structure
4.1.4 Development in China
4.2 HENKEL
4.2.1 Profile
4.2.2 Operation
4.2.3 Revenue Structure
4.2.4 Adhesive Business
4.2.5 Business in China
4.3 THREEBOND
4.3.1 Profile
4.3.2 Operation
4.3.2 Development in China
4.4 3M
4.4.1 Profile
4.4.2 Operation
4.4.3 Revenue Structure
4.4.4 Development in China
4.5 ITW
4.5.1 Profile
4.5.2 Operation
4.5.3 Revenue Structure
4.5.4 Adhesive Business
4.5.5 Development in China
4.6 SIKA
4.6.1 Profile
4.6.2 Operation
4.6.3 Revenue Structure
4.6.4 Development in China
4.7 MOMENTIVE
4.7.1 Profile
4.7.2 Momentive Specialty Chemicals
4.7.3 Momentive Performance Materials
4.7.4 Development in China
4.8 DOW CORNING
4.8.1 Profile
4.8.2 Operation
4.8.3 Development in China
5. China’s Major Suppliers
5.1 Hubei Huitian Adhesive Enterprise Co., Ltd.
5.1.1 Profile
5.1.2 Operation
5.1.3 Revenue Structure
5.1.4 Gross Margin
5.1.5 R&D and Investment
5.1.6 Development Outlook
5.2 Shanghai KangDa New Materials Co., Ltd.
5.2.1 Profile
5.2.2 Operation
5.2.3 Revenue Structure
5.2.4 Gross Margin
5.2.5 R&D and Investment
5.2.6 Development Outlook
5.3 Chengdu Guibao Science & Technology Co., Ltd.
5.3.1 Profile
5.3.2 Operation
5.3.3 Revenue Structure
5.3.4 Gross Margin
5.3.5 R&D and Investment
5.3.6 Development Outlook
5.4 Beijing COMENS New Material Co., Ltd.
5.4.1 Profile
5.4.2 Operation
5.4.3 Revenue Structure
5.4.4 Gross Margin
5.4.5 R&D and Investment
5.4.6 Development Outlook
5.5 Beijing TONSAN Adhesive Co., Ltd.
5.5.1 Profile
5.5.2 Operation
5.6 Shandong North Modern Chemistry Industry Co., Ltd.
5.7 Guangzhou Baiyun Chemical Industry Co., Ltd.
5.7.1 Profile
5.7.2 Operation
5.8 Hangzhou Zhijiang Silicone Chemicals Co., Ltd.
5.8.1 Profile
5.8.2 Operation
5.9 Guangzhou Xinzhan Silicone Co., Ltd.
5.9.1 Profile
5.9.2 Guangdong Xinzhan New Chemical Material Co., Ltd.
Definition and Classification of Adhesives
Classification and Application of Structural Adhesive
Structural Adhesive Industry Chain
Major Policies Concerning Structural Adhesive in China
Output and YoY Growth Rate of China Adhesive Industry, 2003-2012
Sales and YoY Growth of China Structural Adhesive Industry, 2003-2012
Output and YoY Growth Rate of China Structural Adhesive Industry, 2007-2012
China Structural Adhesive Products Structure by Chemical Composition, 2012
China Structural Adhesive Market Capacity by Application, 2012
Export Volume, Export Value and Average Export Price of Adhesives in China, 2010-2012
Export Destinations, Export Volume and Export Value of Adhesives in China, 2012
Import Volume, Import Value and Average Import Price of Adhesives in China, 2010-2012
Import Origins, Import Volume and Import Value of Adhesives in China, 2012
New Construction Area of Buildings in China by Type, 2005-2012
Automotive Output and YoY Growth Rate in China, 2005-2012
Newly Installed Wind Power Capacity in China and Beyond, 2005-2012
Cumulative PV Installed Capacity in China, 2006-2012
Revenue and Total Profit of Electronic Components Manufacturing in China, 2008-2012
Output of Some Electronics in China, 2009-2012
Approved Urban Rail Projects in China, 2012
Structural Adhesive Output in China, 2012-2015E
Silicone Structural Adhesive Output and YoY Growth Rate in China, 2008-2012
Epoxy Structural Adhesive Output and YoY Growth Rate in China, 2008-2012
Application of Epoxy Structural Adhesive in Downstream Sectors, 2012 (%)
PU Structural Adhesive Output and YoY Growth Rate in China, 2008-2012
Production Equipments of Fuller, 2012
Revenue and EBITD of Fuller, 2009-2012
Revenue of Fuller by Region, 2010-2012
Revenue Breakdown of Fuller by Region, 2010-2012
China-based Plants of H.B. Fuller, by End-2012
Regional Distribution of Employees of Henkel, 2012
Revenue and EBIT of Henkel, 2009-2012
Revenue of Henkel by Business, 2009-2012
Revenue of Henkel by Region, 2009-2012
R&D Expenditure Structure of Henkel by Business, 2012
Henkel’s Revenue from Adhesive Business by Product, 2009-2012
Henkel’s EBIT from Adhesive Business by Product, 2009-2012
Henkel’s Stage-II Project-140,000 tons/a Adhesive Project
Revenue of Threebond, 1998-2010
Revenue of Threebond, 2010
Branches of Threebond in China
Revenue and Operating Profit of 3M, 2009-2012
Revenue of 3M by Business, 2010-2012
Operating Profit of 3M by Business, 2010-2012
Revenue and Operating Profit of ITW, 2009-2012
Revenue Breakdown of ITW by Business ,2012
Revenue Breakdown of ITW by Product ,2012
Revenue Breakdown of ITW by Region ,2012
Major Products and Terminal Markets of ITW’s Polymer & Fluid Chemical Industry Business Division, 2012
Revenue and Operating Profit of Sika, 2009-2012
Revenue of Sika by Region, 2011-2012
Revenue Breakdown of Sika by Sector, 2011-2012
Subsidiaries under Sika in China, as of Late 2012
Revenue and EBITD of MSC, 2011-2012
Revenue Breakdown of MSC by Product, 2011-2012
Revenue and Profit of MPM, 2011-2012
Revenue Breakdown of MPM by Product, 2010-2012
Revenue and Net Income of Cow Corning, 2008-2012
Output, Sales Volume and Inventories of Major Products of Huitian Adhesive, 2011-2012
Revenue and Net Income of Huitian Adhesive, 2009-2012
Revenue of Huitian Adhesive by Product, 2010-2012
Revenue of Huitian Adhesive by Application, 2009-2012
Revenue of Huitian Adhesive by Region, 2009-2012
Gross Margin of Huitian Adhesive by Product, 2009-2012
R&D Costs and % of Total Revenue of Huitian Adhesive, 2009-2012
Revenue and Net Income of Huitian Adhesive, 2012-2015E
Adhesive Output and Sales Volume of KangDa New Materials, 2009-2012
Revenue and Net Income of Shanghai KangDa New Materials, 2009-2012
Revenue of Shanghai KangDa New Materials by Product, 2008-2011
Revenue of Kangda Chemical by Region, 2008-2011
Gross Margin of Shanghai KangDa New Materials by Product, 2009-2012
R&D Costs and % of Total Revenue of Shanghai KangDa New Materials, 2010-2012
Planned New Projects of Shanghai KangDa New Materials, as of Late 2012
Revenue and Net Income of Shanghai KangDa New Materials, 2012-2015E
Output, Sales Volume and Inventories of Major Products of Chengdu Guibao Science & Technology, 2011-2012
Revenue and Net Income of Chengdu Guibao Science & Technology, 2009-2012
Revenue of Chengdu Guibao Science & Technology by Product, 2009-2012
Revenue of Chengdu Guibao Science & Technology by Region, 2009-2012
Gross Margin of Chengdu Guibao Science & Technology by Product, 2009-2012
R&D Costs and % of Total Revenue of Chengdu Guibao Science & Technology, 2009-2012
Revenue and Net Income of Chengdu Guibao Science & Technology, 2012-2015E
Output, Sales Volume and Inventories of Polyurethane Adhesive of Beijing COMENS New Material, 2011-2012
Revenue and Net Income of Beijing COMENS New Material, 2009-2012
Revenue of Beijing COMENS New Material by Product, 2009-2012
Revenue of Beijing COMENS New Material by Region, 2009-2012
Gross Margin of Beijing COMENS New Material by Product, 2009-2012
R&D Costs and % of Total Revenue of Beijing COMENS New Material, 2009-2012
Revenue and Net Income of Beijing COMENS New Material, 2012-2015E
Subsidiaries under TONSAN Adhesive
Output of TONSAN Adhesive by Product, 2011-2012
Planned Fundraising Projects and Investment of TONSAN Adhesive
Revenue and Operating Profit of Shandong Norinc Sealant & Adhesive, 2008-2009
Revenue and Operating Profit of Baiyun Chemical, 2007-2009
Revenue and Operating Profit of Hangzhou Zhijiang Silicone Chemicals, 2008-2009
Global and China Synthetic Rubber Industry Report, 2021-2027
Synthetic rubber is a polymer product made of coal, petroleum and natural gas as main raw materials and polymerized with dienes and olefins as monomers, which is typically divided into general synthet...
Global and China Carbon Fiber Industry Report, 2021-2026
Carbon fiber is a kind of inorganic high performance fiber (with carbon content higher than 90%) converted from organic fiber through heat treatment. As a new material with good mechanical properties,...
Global and China Dissolving Pulp Industry Report, 2019-2025
In 2018, global dissolving pulp capacity outstripped 10 million tons and its output surged by 14.0% from a year ago to 7.07 million tons, roughly 70% of the capacity. China, as a key supplier of disso...
Global and China 1, 4-butanediol (BDO) Industry Report, 2019-2025
1,4-butanediol (BDO), an essential organic and fine chemical material, finds wide application in pharmaceuticals, chemicals, textile and household chemicals.
As of the end of 2018, the global BDO cap...
Global and China Carbon Fiber and CFRP Industry Report, 2019-2025
Among the world’s three major high performance fibers, carbon fiber features the highest strength and the highest specific modulus. It is widely used in such fields as aerospace, sports and leisure.
...
Global and China Natural Rubber Industry Report, 2019-2025
In 2018, global natural rubber industry continued remained at low ebb, as a result of economic fundamentals. Global natural rubber price presented a choppy downtrend and repeatedly hit a record low in...
Global and China Ultra High Molecular Weight Polyethylene (UHMWPE) Industry Report, 2019-2025
Ultra high molecular weight polyethylene (UHMWPE), a kind of linear polyethylene with relative molecular weight of above 1.5 million used as an engineering thermoplastic with excellent comprehensive p...
China Polyether Monomer Industry Report, 2019-2025
China has seen real estate boom and issued a raft of policies for continuous efforts in improving weak links in infrastructure sector over the years. Financial funds of RMB1,663.2 billion should be al...
Global and China Viscose Fiber Industry Report, 2019-2025
Over the recent years, the developed countries like the United States, Japan and EU members have withdrawn from the viscose fiber industry due to environmental factor and so forth, while the viscose f...
Global and China Synthetic Rubber (BR, SBR, EPR, IIR, NBR, Butadiene, Styrene, Rubber Additive) Industry Report, 2018-2023
In 2018, China boasted a total synthetic rubber capacity of roughly 6,667kt/a, including 130kt/a new effective capacity. Considering capacity adjustment, China’s capacity of seven synthetic rubbers (B...
Global and China Dissolving Pulp Industry Report, 2018-2022
With the commissioning of new dissolving pulp projects, the global dissolving pulp capacity had been up to about 8,000 kt by the end of 2017. It is worth noticing that the top six producers including ...
Global and China Carbon Fiber and CFRP Industry Report, 2018-2022
As a new generation of reinforced fiber boasting intrinsic properties of carbon material and excellent processability of textile fiber, carbon fiber is the one with the highest specific strength and s...
Global and China Ultra High Molecular Weight Polyethylene (UHMWPE) Industry Report, 2017-2021
Ultra High Molecular Weight Polyethylene (UHMWPE), a kind of linear polyethylene with relative molecular weight of above 1.5 million and an engineering thermoplastic with excellent comprehensive prope...
Global and China Aramid Fiber Industry Report, 2017-2021
Global aramid fiber output totaled 115kt with capacity utilization of 76.0% in 2016. As industries like environmental protection and military develop, the output is expected to rise to 138kt and capac...
Global and China Natural Rubber Industry Report, 2017-2021
In 2016, the global natural rubber output edged up 1.1% year on year to 12.4 million tons, and the consumption rose by 3.8% year on year to 12.6 million tons, indicating the gap of 200,000 tons betwee...
China Synthetic Rubber Industry Report, 2017-2021
Synthetic rubber is one of important strategic materials, mainly used in tyres and other industries. In 2016, the global output and consumption of synthetic rubber reached 14.822 million tons and 14.9...
Global and China 1,4-butanediol (BDO) Industry Report, 2017-2021
1,4-butanediol (BDO) is a key raw material for organic and fine chemicals, capable of generating various derivatives like THF, PTMEG and GBL. BDO and its derivatives find wide application in PBT plast...
Global and China Ethylene Oxide (EO) Industry Report, 2017-2021
Ethylene oxide (EO) is one of the major derivatives of the ethylene industry. Featured with special reactivity, it can generate a series of fine chemical products for a wide range of applications.
In...