Global and China Polyurethane Industry Chain Report, 2013-2016
-
Jan./2014
- Hard Copy
- USD
$2,400
-
- Pages:110
- Single User License
(PDF Unprintable)
- USD
$2,300
-
- Code:
HK041
- Enterprise-wide License
(PDF Printable & Editable)
- USD
$3,600
-
- Hard Copy + Single User License
- USD
$2,600
-
Polyurethane products include polyurethane rigid foam, soft foam, elastomers, coatings, adhesives, fibers, etc., widely used in many fields such as automobile, refrigerator, construction, footwear, synthetic leather and fabric.
In 2013, the global output of polyurethane products hit about 19 million tons, 60% of which were polyurethane rigid and soft foam. In recent years, with the rapid growth in the polyurethane demand in Asia-Pacific region, the global polyurethane production center has transferred to Asia-Pacific, especially China.
In 2006-2013, China's demand for polyurethane products presented an AAGR of 11.2%. China's demand accounted for 43% of the world’s total demand in 2013. Among Chinese polyurethane products, the demand for polyurethane rigid foam, soft foam, synthetic leather slurry and paint was huge, equivalent to roughly 80% of China's total demand for polyurethane products in 2013.
Polyurethane raw materials cover isocyanate (MDI, TDI), polyol (PPG, PTMEG, BDO, AA) and additives (DMF).
1 MDI
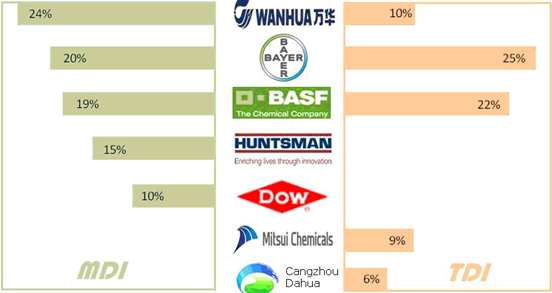
In 2013, the global MDI capacity of 6.8 million tons was generated by just 10 manufacturers or so in this industry, showing a high degree of concentration. In point of capacity, the top three companies -- Chinese Wanhua Chemical, Bayer and BASF contributed 62.9% to the world's total capacity; their counterparts consist of Huntsman, Dow, Nippon Polyurethane Industry and so on. The global polyurethane capacity is mainly available in China, the United States and Europe, in which China occupies about 1/3 share.
2 TDI
In 2013, the global TDI capacity approximated 2.6 million tons, 71.2% of which was contributed by Bayer, BASF, BorsodChem (a subsidiary of Wanhua Chemical), Japan Mitsui and China Cangzhou Dahua. The global TDI capacity is mainly distributed in China holding 1/3 share, the United States and South Korea.
3 PPG
Bayer, Dow, Shell and BASF dominate the global PPG industry. The capacity of numerous Chinese PPG manufacturers is rather limited; major Chinese companies include SINOPEC Shanghai Gaoqiao, Shandong Dongda Chemical, Nanjing Hongbaoli and so forth.
World’s Major MDI/TDI Companies and Their Capacity Proportions, 2013
Source: Above Companies; ResearchInChina
The report highlights the followings:
Supply, demand, product structure and geographical distribution of the global polyurethane industry;
Industrial policies, supply, demand, product structure, import, export and development trends of China polyurethane industry;
Demand and consumption structure of global and Chinese polyurethane rigid foam, soft foam, elastomer, paint and other market segments;
Capacity, competition patterns, import, export and prices of global and Chinese MDI, TDI, PPG and other industries;
The demand of Chinese building energy saving, refrigeration, water heater and automobile industries for polyurethane;
Operation and polyurethane business of 10 global and Chinese polyurethane and raw materials production enterprises.
1 Overview of Polyurethane Industry
1.1 Overview
1.2 Raw Materials
1.3 Products
1.4 Industry Chain
2 Polyurethane Market
2.1 Global Market
2.2 Chinese Market
2.2.1 Status Quo
2.2.2 Policy
2.2.3 Supply and Demand
2.2.4 Import and Export
2.2.5 Development Trend
3 Polyurethane Market Segments
3.1 Polyurethane Rigid Foam
3.1.1 Overview
3.1.2 Global Market
3.1.3 Chinese Market
3.2 Polyurethane Soft Foam
3.3 CASE System
3.3.1 Synthetic Leather Slurry
3.3.2 Paint
3.3.3 Polyurethane Elastomer
3.3.4 Polyurethane Fiber
3.3.5 Others
4 Upstream Polyurethane Materials
4.1 MDI
4.1.1 Global Market
4.1.2 Chinese Market
4.1.3 Import and Export
4.1.4 Price
4.2 TDI
4.2.1 Global Market
4.2.2 Chinese Market
4.2.3 Import and Export
4.2.4 Price
4.3 PPG
4.3.1 Global Market
4.3.2 Chinese Market
4.3.3 Price
4.4 Others
4.4.1 AA
4.4.2 BDO
4.4.3 PTMEG
4.4.4 DMF
4.4.5 PO
5 Downstream Demand for Polyurethane
5.1 Demand of Building Energy Saving Industry
5.1.1 Performance Comparison
5.1.2 Cost Comparison
5.1.3 Fireproof Performance
5.1.4 Demand Analysis
5.2 Demand of Refrigeration Industry
5.3 Demand of Water Heater Industry
5.4 Demand of Automobile Industry
6 Key Global Companies
6.1 BASF
6.1.1 Profile
6.1.2Operation
6.1.3 Operation of Plastic Division
6.1.4 Polyurethane Business
6.1.5 Business in China
6.2 Bayer
6.2.1 Profile
6.2.2 Operation
6.2.3 Operation of Bayer MaterialScience
6.2.4 Polyurethane Business
6.2.5 Development in China
6.3 Huntsman
6.3.1 Profile
6.3.2 Operation
6.3.3 Revenue Structure
6.3.4 Polyurethane Business
6.3.5 Development in China
6.4 Dow Chemical
6.4.1 Profile
6.4.2 Operation
6.4.3 Operation of High Performance Materials Division
6.4.4 Polyurethane Business
6.4.5 Development in China
6.5 Nippon Polyurethane Industry Co.,Ltd.
7 Major Chinese Companies
7.1 Wanhua Chemical Group Co., Ltd.
7.1.1 Profile
7.1.2 Operation
7.1.3 Revenue Structure
7.1.4 Gross Margin
7.1.5 R & D
7.1.6 Polyurethane Business
7.1.7 Anticipation and Outlook
7.2 Cangzhou Dahua Group Co., Ltd.
7.2.1 Profile
7.2.2 Operation
7.2.3 Revenue Structure
7.2.4 Gross Margin
7.2.5 R & D
7.2.6 TDI Business
7.2.7 Anticipation and Outlook
7.3 Yantai Juli Fine Chemical Co., Ltd.
7.3.1 Profile
7.3.2 Operation
7.3.3 TDI Business
7.4 Nanjing Hongbaoli Co., Ltd.
7.4.1 Profile
7.4.2 Operation
7.4.3 Revenue Structure
7.4.4 Gross Margin
7.4.5 R & D
7.4.6 Polyurethane Business
7.4.7 Anticipation and Outlook
7.5 Lecron Energy Saving Materials Co., Ltd.
7.5.1 Profile
7.5.2 Operation
7.5.3 Revenue Structure
7.5.4 Gross Margin
7.5.5 R & D
7.5.6 Combined Polyether Rigid Foam Business
7.5.7 Anticipation and Outlook
8 Summary and Forecast
8.1 Summary
8.2 Forecast
Performance Comparison between Polyurethane Materials and Conventional Materials
Classification of Polyurethane Raw Materials
Polyurethane Products, Raw Materials and Their Applications
Polyurethane Industry Chain
Global Output of Polyurethane Products, 2001-2013
Global Polyurethane Product Structure (by Output), 2013
Regional Distribution of Global Polyurethane Products (by Output), 2013
China’s Polyurethane Industry-related Policies, 2011-2015E
China’s Polyurethane Product Demand and YoY Growth, 2006-2013
China’s Polyurethane Product Structure (by Demand), 2013
China’s Polyurethane Resin Import and Export Volume, 2008-2013
Average Import and Export Prices of China’s Polyurethane Resin, 2008-2013
China’s Polyurethane Resin Import Sources (by Import Volume), Jan-Oct 2013
Geographical Distribution of China’s Polyurethane Resin Export (by Export Volume), Jan-Oct 2013
Polyurethane Rigid Foam Raw Materials and Their Functions
Global Polyurethane Rigid Foam Demand and Growth Rate, 2006-2013
Consumption Structure of Polyurethane Rigid Foam in USA, 2013
China’s Polyurethane Rigid Foam Demand and Growth Rate, 2006-2013
Consumption Structure of Polyurethane Rigid Foam in China, 2013
China’s Polyurethane Soft Foam Demand and Growth Rate, 2006-2013
Major Global MDI Enterprises and Their Capacity, 2013
Major Global Proposed / Ongoing MDI Projects, 2014-2016E
Regional Distribution of Global MDI Capacity, 2013
Capacity Proportion of Major Global MDI Enterprises, 2013
Capacity of Chinese MDI Enterprises, 2009-2013
China’s Pure MDI Import and Export Volume, 2008-2013
Average Import and Export Prices of Pure MDI in China, 2008-2013
Distribution of China’s Pure MDI Import Sources (by Import Volume), Jan-Oct 2013
Regional Distribution of China’s Pure MDI Export (by Export Volume), Jan-Oct 2013
China’s Polymeric MDI Import and Export Volume, 2008-2013
Average Import and Export Prices of Polymeric MDI in China, 2008-2013
Distribution of China’s Polymeric MDI Import Sources (by Import Volume), Jan-Oct 2013
Regional Distribution of China’s Polymeric MDI Export (by Export Volume), Jan-Oct 2013
China’s MDI Average Monthly Price, 2009-2013
Major Global TDI Enterprises and Their Capacity, 2013
Some Global Proposed / Ongoing TDI Projects, 2014
Regional Distribution of Global TDI Capacity, 2013
Capacity Proportion of Major Global TDI Enterprises, 2013
Capacity of Chinese TDI Enterprises, 2009-2013
Major Proposed / Ongoing TDI Projects in China, 2014
China’s TDI Import and Export Volume, 2008-2013
Average Import and Export Prices of TDI in China, 2008-2013
China’s TDI Import Sources (by Import Volume), Jan-Oct 2013
Distribution of China’s TDI Export Destinations (by Export Volume), Jan-Oct 2013
China’s TDI Average Monthly Price, 2006-2013
Major Chinese Polyether Polyol Enterprises and Their Capacity, 2013
China’s Polyether Polyol Output and Growth Rate, 2007-2013
China’s Polyether (5613) Average Monthly Price, 2006-2013
Schematic Diagram of Traditional Wall Insulation Materials
Performance Comparison between Main Building Insulation Materials
Thickness of Different Insulation Materials for Same Effect
Comparison between Three Construction Methods of Polyurethane Rigid Foam
Demand of China Building Energy Saving Industry for Polyurethane Rigid Foam, 2010-2015E
China’s Output of Refrigerators and Freezers, 2011-2015E
Demand of Refrigerators and Freezers for Polyurethane Rigid Foam in China, 2010-2015E
Major Policies on Promotion of Solar Water Heaters in China
Demand of China Solar Water Heater Industry for Polyurethane Rigid Foam, 2011-2015E
Revenue and EBITDA of BASF’s Plastic Division, 2010-2012
Revenue Structure of BASF’s Plastic Division (by Product), 2010-2012
BASF’s Polyurethane Products
BASF’s Polyurethane Revenue, 2008-2012
BASF’s Polyurethane Revenue Structure (by Region), 2010-2012
BASF’s MDI Capacity Distribution and Proposed / Ongoing Construction Projects, 2013
BASF’s TDI Capacity Distribution and Proposed / Ongoing Construction Projects, 2013
Bayer’s Revenue and Net Income, 2009-2013
Bayer’s Revenue Structure (by Division), 2011-2013
Revenue and EBITDA of Bayer MaterialScience, 2009-2013
Revenue of Bayer MaterialScience (by Product), 2011-2013
Revenue Structure of Bayer MaterialScience (by Product), 2011-2013
Revenue of Bayer MaterialScience (by Region), 2011-2013
Revenue Structure of Bayer MaterialScience (by Region), 2011-2013
Bayer’s MDI Capacity Distribution and Proposed / Ongoing Construction Projects, 2013
Bayer’s TDI Capacity Distribution and Proposed / Ongoing Construction Projects, 2013
Huntsman’s Divisions and Main Products
Huntsman’s Revenue and Net Income, 2009-2013
Huntsman’s Revenue (by Division), 2011-2013
Huntsman’s Revenue Structure (by Division), 2011-2013
Huntsman’s Revenue (by Region), 2010-2012
Huntsman’s Revenue Structure (by Region), 2010-2012
Revenue and EBITDA of Huntsman’s Polyurethane Division, 2009-2013
Huntsman’s MDI Capacity Distribution and Proposed / Ongoing Construction Projects, 2013
Net Sales and Net Income of Dow Chemical, 2008-2012
Revenue Structure of Dow Chemical (by Division), 2012
Revenue and EBITDA of High Performance Materials Division of Dow Chemical, 2009-2012
Sales Proportion of High Performance Materials Division (by Product) of Dow Chemical, 2012
MDI Capacity Distribution of Dow Chemical, 2013
MDI Capacity Distribution of Nippon Polyurethane Industry, 2013
Revenue and Net Income of Wanhua Chemical, 2009-2013
Revenue of Wanhua Chemical (by Product), 2011-2013
Revenue Structure of Wanhua Chemical (by Product), 2011-2013
Revenue of Wanhua Chemical (by Region), 2011-2013
Revenue Structure of Wanhua Chemical (by Region), 2011-2013
Gross Margin of Main Products of Wanhua Chemical, 2011-2013
R & D Costs and % of Total Revenue of Wanhua Chemical, 2011-2013
Main Products of Wanhua Chemical
MDI Capacity Expansion of Wanhua Chemical, 2011-2014E
Revenue and Net Income of Wanhua Rongwei, 2009-2013
Revenue and Net Income of Wanhua Chemical, 2012-2016E
Revenue and Net Income of Cangzhou Dahua, 2009-2013
Revenue of Cangzhou Dahua (by Product), 2011-2013
Revenue Structure of Cangzhou Dahua (by Product), 2011-2013
Gross Margin of Main Products of Cangzhou Dahua, 2011-2013
R & D Costs and % of Total Revenue of Cangzhou Dahua , 2011-2013
TDI Capacity, Output and Operating Rate of Cangzhou Dahua, 2008-2013
Revenue and Net Income of Cangzhou Dahua, 2012-2016E
Operating Revenue, Total Profit and Gross Margin of Yantai Juli, 2007-2009
Hongbaoli’s Revenue and Net Income, 2009-2013
Hongbaoli’s Revenue (by Product), 2011-2013
Hongbaoli’s Revenue Structure (by Product), 2011-2013
Hongbaoli’s Revenue (by Region), 2011-2013
Hongbaoli’s Revenue Structure (by Region), 2011-2013
Hongbaoli’s Gross Margin of Main Products, 2011-2013
Hongbaoli’s R&D Costs and % of Total Revenue, 2011-2013
Capacity of Hongbaoli’s Combined Polyether Rigid Foam, 2009-2013
Hongbaoli’s Revenue and Net Income, 2012-2016E
Revenue and Net Income of Lecron Energy Saving Materials, 2009-2013
Revenue of Lecron Energy Saving Materials (by Product), 2011-2013
Revenue Structure of Lecron Energy Saving Materials (by Product), 2011-2013
Gross Margin of Main Products of Lecron Energy Saving Materials, 2011-2013
R & D Costs and % of Total Revenue of Lecron Energy Saving Materials, 2010-2012
Capacity, Output and Operating Rate of Combined Polyether Rigid Foam of Lecron Energy Saving Materials, 2009-2011
Revenue and Net Income of Lecron Energy Saving Materials, 2012-2016E
Polyurethane Business of Major Global and Chinese Companies, 2012
Consumption of Global and Chinese Polyurethane Products, 2013-2016E
Global and Chinese MDI Capacity, 2013-2016E
Global and Chinese TDI Capacity, 2013-2016E
Global and China Synthetic Rubber Industry Report, 2021-2027
Synthetic rubber is a polymer product made of coal, petroleum and natural gas as main raw materials and polymerized with dienes and olefins as monomers, which is typically divided into general synthet...
Global and China Carbon Fiber Industry Report, 2021-2026
Carbon fiber is a kind of inorganic high performance fiber (with carbon content higher than 90%) converted from organic fiber through heat treatment. As a new material with good mechanical properties,...
Global and China Dissolving Pulp Industry Report, 2019-2025
In 2018, global dissolving pulp capacity outstripped 10 million tons and its output surged by 14.0% from a year ago to 7.07 million tons, roughly 70% of the capacity. China, as a key supplier of disso...
Global and China 1, 4-butanediol (BDO) Industry Report, 2019-2025
1,4-butanediol (BDO), an essential organic and fine chemical material, finds wide application in pharmaceuticals, chemicals, textile and household chemicals.
As of the end of 2018, the global BDO cap...
Global and China Carbon Fiber and CFRP Industry Report, 2019-2025
Among the world’s three major high performance fibers, carbon fiber features the highest strength and the highest specific modulus. It is widely used in such fields as aerospace, sports and leisure.
...
Global and China Natural Rubber Industry Report, 2019-2025
In 2018, global natural rubber industry continued remained at low ebb, as a result of economic fundamentals. Global natural rubber price presented a choppy downtrend and repeatedly hit a record low in...
Global and China Ultra High Molecular Weight Polyethylene (UHMWPE) Industry Report, 2019-2025
Ultra high molecular weight polyethylene (UHMWPE), a kind of linear polyethylene with relative molecular weight of above 1.5 million used as an engineering thermoplastic with excellent comprehensive p...
China Polyether Monomer Industry Report, 2019-2025
China has seen real estate boom and issued a raft of policies for continuous efforts in improving weak links in infrastructure sector over the years. Financial funds of RMB1,663.2 billion should be al...
Global and China Viscose Fiber Industry Report, 2019-2025
Over the recent years, the developed countries like the United States, Japan and EU members have withdrawn from the viscose fiber industry due to environmental factor and so forth, while the viscose f...
Global and China Synthetic Rubber (BR, SBR, EPR, IIR, NBR, Butadiene, Styrene, Rubber Additive) Industry Report, 2018-2023
In 2018, China boasted a total synthetic rubber capacity of roughly 6,667kt/a, including 130kt/a new effective capacity. Considering capacity adjustment, China’s capacity of seven synthetic rubbers (B...
Global and China Dissolving Pulp Industry Report, 2018-2022
With the commissioning of new dissolving pulp projects, the global dissolving pulp capacity had been up to about 8,000 kt by the end of 2017. It is worth noticing that the top six producers including ...
Global and China Carbon Fiber and CFRP Industry Report, 2018-2022
As a new generation of reinforced fiber boasting intrinsic properties of carbon material and excellent processability of textile fiber, carbon fiber is the one with the highest specific strength and s...
Global and China Ultra High Molecular Weight Polyethylene (UHMWPE) Industry Report, 2017-2021
Ultra High Molecular Weight Polyethylene (UHMWPE), a kind of linear polyethylene with relative molecular weight of above 1.5 million and an engineering thermoplastic with excellent comprehensive prope...
Global and China Aramid Fiber Industry Report, 2017-2021
Global aramid fiber output totaled 115kt with capacity utilization of 76.0% in 2016. As industries like environmental protection and military develop, the output is expected to rise to 138kt and capac...
Global and China Natural Rubber Industry Report, 2017-2021
In 2016, the global natural rubber output edged up 1.1% year on year to 12.4 million tons, and the consumption rose by 3.8% year on year to 12.6 million tons, indicating the gap of 200,000 tons betwee...
China Synthetic Rubber Industry Report, 2017-2021
Synthetic rubber is one of important strategic materials, mainly used in tyres and other industries. In 2016, the global output and consumption of synthetic rubber reached 14.822 million tons and 14.9...
Global and China 1,4-butanediol (BDO) Industry Report, 2017-2021
1,4-butanediol (BDO) is a key raw material for organic and fine chemicals, capable of generating various derivatives like THF, PTMEG and GBL. BDO and its derivatives find wide application in PBT plast...
Global and China Ethylene Oxide (EO) Industry Report, 2017-2021
Ethylene oxide (EO) is one of the major derivatives of the ethylene industry. Featured with special reactivity, it can generate a series of fine chemical products for a wide range of applications.
In...