China Synthetic Rubber Industry Report, 2013-2017
-
Jan./2014
- Hard Copy
- USD
$2,500
-
- Pages:126
- Single User License
(PDF Unprintable)
- USD
$2,400
-
- Code:
PQ004
- Enterprise-wide License
(PDF Printable & Editable)
- USD
$3,700
-
- Hard Copy + Single User License
- USD
$2,700
-
As a major synthetic rubber producer in the world, China's synthetic rubber capacity reached 4,980kt/a in 2013, accounting for 27% of the global synthetic rubber capacity. Styrene butadiene rubber and polybutadiene rubber are China's major synthetic rubber, contributing 34.4% and 33.3% to the total capacity respectively in 2013. Chinese synthetic rubber giants Sinopec and CNPC occupied 52.4% of China’s synthetic rubber capacity in 2013 together.
With the entry of Panjin Heyun, Liaoning Northern Dynasol, Germany Lanxess and other private or foreign-capital enterprises, the status of Sinopec and CNPC in the synthetic rubber industry will be by degrees weakened, and their combined share in China’s synthetic rubber capacity will drop to 44.1% in 2017.
Styrene Butadiene Rubber: The capacity of the first segment in Chinese synthetic rubber market -- styrene butadiene rubber reached 1,715 kt/a in 2013, of which the emulsion styrene butadiene rubber capacity accounted for 79% of China’s styrene butadiene rubber capacity. China has been at a disadvantageous position in the global solution polymerized styrene butadiene rubber industry, but China will witness rapid expansion at the expected CAGR of 19.5% in 2013-2016.
Polybutadiene Rubber: The capacity of the second segment in Chinese synthetic rubber market -- polybutadiene rubber hit 1,657 kt/a in 2013. At the end of 2013, China raised the polybutadiene rubber capacity by 540 kt/a, representing 62.8% of the new synthetic rubber capacity over the same period. Owing to the rapid release of polybutadiene rubber capacity in 2012 and 2013, China’s polybutadiene rubber capacity utilization slumped and might be 51.7% in 2013. High-performance flat and tubeless radial tires will beome an inevitable trend, so the demand for rare earth polybutadiene rubber will be huge. At the end of 2013, there had been five rare earth polybutadiene rubber manufacturers in China, namely Shandong Huayu Rubber, Sinopec Beijing Yanshan, PetroChina Dushanzi Petrochemical, PetroChina Jinzhou Petrochemical and Qi Xiang Tenda, with the combined capacity of 205 kt/a.
Butyl Rubber: Halogenated butyl rubber is the development priority of Chinese manufacturers. In August 2013, the realization of Panjin Heyun’s 30 kt/a halogenated butyl rubber project filled the gap of China tire brominated butyl rubber industry. Panjin Heyun also plans to accomplish the halogenated butyl rubber capacity of 180 kt/a in the next 3-5 years. Zhejiang Cenway’s 50 kt/a halogenated butyl rubber equipment involved with China’s first halogenated butyl rubber production technology with independent intellectual property rights is expected to be completed and put into operation at the end of 2014.
The report covers the followings:
?China's synthetic rubber capacity, output, consumption, import, export and development trend;
Capacity, output, consumption, import & export, competition pattern, price and development trend of Chinese synthetic rubber products (Polybutadiene Rubber, Styrene Butadiene Rubber, Ethylene Propylene Rubber, Butyl Rubber and Nitrile Rubber);
Capacity, output, consumption, import & export, competition pattern, price and development trend of China's synthetic rubber upstream (Butadiene, Styrene, etc.);
Status quo, synthetic rubber business and prospects of 18 major Chinese synthetic rubber manufacturers.
1 Overview of Synthetic Rubber
1.1 Definition
1.2 Classification
2 Overview of China Synthetic Rubber Industry
2.1 Global Overview
2.2 Market Supply and Demand
2.2.1 Market Supply
2.2.2 Market Demand
2.3 Import and Export
2.3.1 Import
2.3.2 Export
2.4 Product Structure
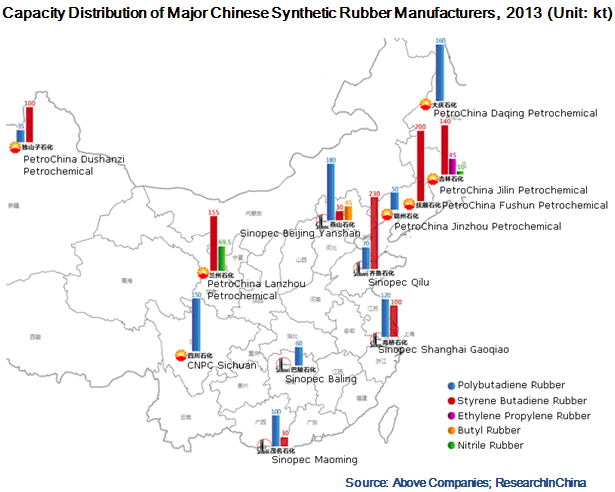
2.5 Main Producing Areas
2.6 Development Trend
3 Key Chinese Synthetic Rubber Market Segments
3.1 Polybutadiene Rubber
3.1.1 Market Supply
3.1.2 Import and Export
3.1.3 Market Demand
3.1.4 Competition Pattern
3.1.5 Price
3.1.6 Development Trend
3.2 Styrene Butadiene Rubber
3.2.1 Market Supply
3.2.2 Import and Export
3.2.3 Market Demand
3.2.4 Competition Pattern
3.2.5 Price
3.2.6 Development Trend
3.3 Ethylene Propylene Rubber
3.3.1 Market Supply
3.3.2 Import and Export
3.3.3 Market Demand
3.3.4 Competition Pattern
3.3.5 Price
3.3.6 Development Trend
3.4 Butyl Rubber
3.4.1 Market Supply
3.4.2 Import and Export
3.4.3 Market Demand
3.4.4 Competition Pattern
3.4.5 Price
3.4.6 Development Trend
3.5 Nitrile Rubber
3.5.1 Market Supply
3.5.2 Import and Export
3.5.3 Market Demand
3.5.4 Competition Pattern
3.5.5 Price
3.5.6 Development Trend
4 Synthetic Rubber Upstream in China
4.1 Butadiene
4.1.1 Market Supply
4.1.2 Import and Export
4.1.3 Market Demand
4.1.4 Price
4.1.5 Competition Pattern
4.1.6 Development Trend
4.2 Styrene
4.2.1 Market Supply
4.2.2 Import and Export
4.2.3 Market Demand
4.2.4 Price
4.2.5 Competition Pattern
4.2.6 Development Trend
4.3 Rubber Additive
4.3.1 Market Supply and Demand
4.3.2 Price
4.3.3 Development Trend
5 Key Chinese Synthetic Rubber Enterprises
5.1 Sinopec
5.1.1 Profile
5.1.2 Operation
5.1.3 Revenue Structure
5.1.4 Gross Margin
5.1.5 Clients and Suppliers
5.1.6 R & D
5.1.7 Synthetic Rubber Business
5.1.8 Sinopec Shanghai Gaoqiao
5.1.9 Sinopec Beijing Yanshan
5.1.10 Sinopec Qilu
5.1.11 Sinopec Maoming
5.1.12 Sinopec Baling
5.1.13 Prospect
5.2 CNPC
5.2.1 Profile
5.2.2 Operation
5.2.3 Revenue Structure
5.2.4 Gross Margin
5.2.5 Clients and Suppliers
5.2.6 R & D
5.2.7 Synthetic Rubber Business
5.2.8 PetroChina Lanzhou Petrochemical
5.2.9 PetroChina Jilin Petrochemical
5.2.10 PetroChina Daqing Petrochemical
5.2.11 PetroChina Dushanzi Petrochemical
5.2.12 PetroChina Jinzhou Petrochemical
5.2.13 PetroChina Fushun Petrochemical
5.2.14 CNPC Sichuan
5.2.15 Prospect
5.3 Yuhuang Chemical
5.3.1 Profile
5.3.2 Operation
5.3.3 Revenue Structure
5.3.4 Gross Margin
5.3.5 Synthetic Rubber Business
5.3.6 Prospect
5.4 TSRC
5.4.1 Profile
5.4.2 Operation
5.4.3 Revenue Structure
5.4.4 Clients and Suppliers
5.4.5 R & D
5.4.6 Synthetic Rubber Business
5.4.7 Prospect
5.5 YPC-GPRO (Nanjing) Rubber
5.5.1 Profile
5.5.2 Operation
5.6 Zhenjiang Nantex Chemical Industry
5.6.1 Profile
5.6.2 Operation
5.7 Lande Fine Chemical
5.7.1 Profile
5.7.2 Operation
5.8 Other Enterprises
5.8.1 Gaoqiao BASF Dispersions
5.8.2 Shanxi Synthetic Rubber
5.8.3 Dow Chemical (Zhangjiagang)
5.8.4 Bridgestone (Huizhou)
5.8.5 Hangzhou Zhechen Rubber
5.8.6 Tianjin Lugang Petroleum Rubber
5.8.7 Fujian Meizhouwan Chlor-Alkali Industry
5.8.8 Zhejiang Cenway Technologies
5.8.9 Chongqing Changshou Chemical
5.8.10 Panjin Heyun
5.8.11 Shandong Huamao New Materials
5.8.12 Qingdao Yikesi
5.8.13 Ningbo Shunze Rubber
5.8.14 Shandong Junteng Synthetic Rubber
5.8.15 Liaoning Northern Dynasol Synthetic Rubber
6 Summary and Forecast
6.1 Summary
6.2 Forecast
Properties and Applications of Synthetic Rubber (by Type)
New Synthetic Rubber Capacity in China, 2013
Major Synthetic Rubber Producers and Their Capacity in China, 2013
China’s Polybutadiene Rubber Capacity (by Enterprise), 2012-2016E
Distribution of China’s Styrene Butadiene Rubber Capacity (by Enterprise), 2012-2016E
Distribution of Ethylene Propylene Rubber Capacity (by Enterprise), 2012-2017E
Distribution of China’s Butyl Rubber Capacity (by Enterprise), 2012-2017E
China’s Nitrile Rubber Capacity (by Enterprise), 2010-2017E
Distribution of China’s Butadiene Capacity (by Enterprise), 2010-2017E
Distribution of China’s Styrene Capacity (by Enterprise), 2010-2017E
Sinopec’s Procurement from Top 5 Suppliers and % of Total Procurement and Share of Largest Supplier, 2010-2012
Sinopec’s Synthetic Rubber Sales Revenue and YoY Growth, 2012-2017E
CNPC’s Major Clients as well as Revenue from Top 5 Clients and % of Total Revenue, 2010-2013
CNPC’s Revenue, Net Income and YoY Growth, 2012-2017E
Distribution of Major Subsidiaries of Yuhuang Chemical, 2013
Synthetic Rubber Capacity, Output and Sales Volume of Yuhuang Chemical, 2010-2013
Revenue, Net Income and YoY Growth of Yuhuang Chemical, 2012-2017E
Revenue Structure of TSRC (by Product), 2010-2012
Name List and Procurement of T TSRC’s Top 3 Suppliers, 2010-2012
TSRC’s Synthetic Rubber Capacity, Output, Output Value and Capacity Utilization, 2010-2012
TSRC’s Synthetic Rubber Capacity (by Enterprise / Product), 2012-2013
TSRC’s Revenue, Net Income and YoY Growth, 2012-2017E
Project Investment and Capacity of Tianjin Lugang Petroleum Rubber
Global Synthetic Rubber Output and Consumption, 2007-2013
Global Synthetic Rubber Output and Consumption Structure, 2007-2013
Global Synthetic Rubber Capacity (by Country/Region), 2013
Global Synthetic Rubber Capacity (by Product), 2013
China’s Synthetic Rubber Capacity and YoY Growth, 2008-2013
China’s Synthetic Rubber Capacity (by Product), 2012-2013
China’s Synthetic Rubber Output and YoY Growth, 2007-2013
China’s Synthetic Rubber Apparent Consumption and Self-sufficiency Rate, 2007-2013
China’s Synthetic Rubber Import Volume and YoY Growth, 2007-2013
China’s Synthetic Rubber Import Value and YoY Growth, 2007-2013
Monthly Average Unit Import Price of Synthetic Rubber in China, 2007-2013
China’s Synthetic Rubber Export Volume and YoY Growth, 2007-2013
China’s Synthetic Rubber Export Value and YoY Growth, 2010-2013
China’s Synthetic Rubber Output (by Type), 2008-2013
Top 10 Synthetic Rubber Provinces (by Output) in China, 2012
Top 10 Synthetic Rubber Provinces (by Output) in China, Jan-Nov 2013
China’s Polybutadiene Rubber Capacity and YoY Growth, 2007-2013
China’s Polybutadiene Rubber Output and YoY Growth, 2007-2013
China’s Polybutadiene Rubber Import Volume and YoY Growth, 2007-2013
China’s Polybutadiene Rubber Export Volume and YoY Growth, 2007-2013
China’s Polybutadiene Rubber Apparent Consumption and Self-sufficiency Rate, 2007-2013
China’s Polybutadiene Rubber Demand Structure (by Purpose), 2012
China’s Polybutadiene Rubber (Grade A) Monthly Average Price, 2008-2013
China’s Styrene Butadiene Rubber Capacity (by Product), 2007-2016E
China's Styrene Butadiene Rubber Output and YoY Growth, 2007-2013
China's Styrene Butadiene Rubber Import Volume and YoY Growth, 2010-2013
China's Styrene Butadiene Rubber Import Value and YoY Growth, 2010-2013
China's Styrene Butadiene Rubber Export Volume and YoY Growth, 2010-2013
China's Styrene Butadiene Rubber Export Value and YoY Growth, 2010-2013
China’s Styrene Butadiene Rubber Apparent Consumption and Self-sufficiency Rate, 2007-2013
China’s Demand Structure of Styrene Butadiene Rubber (by Purpose), 2013
Monthly Average Price of Styrene Butadiene Rubber (1500) in China, 2008-2013
China's Ethylene Propylene Rubber Output and YoY Growth, 2007-2013
China's Ethylene Propylene Rubber Import Volume and YoY Growth, 2007-2013
China's Ethylene Propylene Rubber Export Volume and YoY Growth, 2007-2013
China’s Ethylene Propylene Rubber Apparent Consumption and Self-sufficiency Rate, 2007-2013
China’s Demand Structure of Ethylene Propylene Rubber (by Purpose), 2013
Monthly Average Price of Ethylene Propylene Rubber (by Product) in China, 2009-2013
China's Butyl Rubber Output and YoY Growth, 2007-2013
China's Butyl Rubber Import Volume and YoY Growth, 2007-2013
China's Butyl Rubber Import Value and YoY Growth, 2010-2013
China's Butyl Rubber Export Volume and YoY Growth, 2007-2013
China's Butyl Rubber Export Value and YoY Growth, 2010-2013
China’s Butyl Rubber Apparent Consumption and Self-sufficiency Rate, 2007-2013
China’s Demand Structure of Butyl Rubber (by Purpose), 2013
China's Butyl Rubber (301) Monthly Average Price, 2008-2013
China's Nitrile Rubber Capacity and Capacity Utilization, 2008-2013
China's Nitrile Rubber Output and YoY Growth, 2007-2013
China's Nitrile Rubber Import Volume and YoY Growth, 2007-2013
China's Nitrile Rubber Import Value and YoY Growth, 2010-2013
China's Nitrile Rubber Export Volume and YoY Growth, 2010-2013
China's Nitrile Rubber Export Value and YoY Growth, 2010-2013
China’s Nitrile Rubber Apparent Consumption and Self-sufficiency Rate, 2010-2013
China's Nitrile Rubber Demand Structure (by Purpose), 2013
China's Nitrile Rubber (26) Monthly Average Price, 2008-2013
China's Butadiene Capacity and Capacity Utilization, 2010-2013
China's Butadiene Output and YoY Growth, 2007-2013
China's Butadiene Import Volume and YoY Growth, 2007-2013
China's Butadiene Export Volume and YoY Growth, 2007-2013
China’s Butadiene Apparent Consumption and Self-sufficiency Rate, 2007-2013
China’s Butadiene Demand Structure (by Purpose), 2013
China’s Butadiene Monthly Average Price, 2008-2013
China’s Butadiene Capacity Structure (by Enterprise), 2010-2017E
China’s Styrene Capacity and Capacity Utilization, 2010-2013
China’s Styrene Output and YoY Growth, , 2007-2013
China’s Styrene Import Volume and YoY Growth, 2007-2013
China’s Styrene Import Value and YoY Growth, 2007-2013
China’s Styrene Export Volume and YoY Growth, 2007-2013
China’s Nitrile Rubber Export Value and YoY Growth, 2007-2013
China’s Styrene Apparent Consumption and Self-sufficiency Rate, 2007-2013
China’s Styrene Demand Structure (by Purpose), 2013
China’s Styrene (Grade A) Monthly Average Price, 2008-2013
China’s Rubber Additive Output and YoY Growth, 2009-2013
China’s Rubber Additive Output (by Product), 2012
China’s Rubber Additive Demand Structure (by Purpose), 2013
China’s Rubber Additive Monthly Average Price (by Product), 2008-2013
Sinopec’s Revenue and YoY Growth, 2008-2013
Sinopec’s Net Income and YoY Growth, 2008-2013
Sinopec’s Revenue (by Industry), 2008-2013
Sinopec’s Gross Margin (by Industry), 2008-2013
Sinopec’s Revenue from Top 5 Clients and % of Total Revenue, 2008-2013
Sinopec’s R & D Expenditures and YoY Growth, 2008-2013
Sinopec’s Synthetic Rubber Output and YoY Growth, 2008-2013
Sinopec’s Synthetic Rubber Sales Volume and YoY Growth, 2008-2013
Sinopec’s Synthetic Rubber Sales Revenue and YoY Growth, 2008-2013
CNPC’s Revenue and YoY Growth, 2008-2013
CNPC’s Net Income and YoY Growth, 2008-2013
CNPC’s Revenue (by Industry), 2008-2013
CNPC’s Revenue (by Region), 2008-2013
CNPC’s Gross Margin (by Industry), 2008-2013
R & D Expenditures and % of Total Revenue of CNPC, 2008-2013
CNPC’s Synthetic Rubber Output and YoY Growth, 2008-2013
Revenue and Net Income of Yuhuang Chemical, 2009-2013
Revenue of Yuhuang Chemical (by Industry), 2009-2013
Gross Margin of Yuhuang Chemical (by Division), 2009-2012
Synthetic Rubber Sales Revenue and Average Price of Yuhuang Chemical, 2010-2012
Distribution of Subsidiaries of TSRC, 2012
Revenue and YoY Growth of TSRC, 2010-2013
Net Income and YoY Growth of TSRC, 2010-2013
R & D Expenditures and YoY Growth of TSRC, 2008-2013
Synthetic Rubber Sales Volume of TSRC (by Region), 2008-2012
Synthetic Rubber Revenue of TSRC (by Region), 2008-2012
Revenue and YoY Growth of Zhenjiang Nantex Chemical Industry, 2008-2012
Revenue and YoY Growth of Lande Fine Chemical, 2009-2012
Global Share of Chinese Synthetic Rubber Capacity (by Product), 2013
Global Synthetic Rubber Output and Consumption, 2007-2017E
China’s Synthetic Rubber Output and YoY Growth, 2007-2017E
China’s Polybutadiene Rubber Output and YoY Growth, 2007-2017E
China’s Styrene Butadiene Rubber Output and YoY Growth, 2007-2017E
China’s Ethylene Propylene Rubber Output and YoY Growth, 2007-2017E
China’s Butyl Rubber Output and YoY Growth, 2007-2017E
China’s Nitrile Rubber Output and YoY Growth, 2007-2017E
Global and China Synthetic Rubber Industry Report, 2021-2027
Synthetic rubber is a polymer product made of coal, petroleum and natural gas as main raw materials and polymerized with dienes and olefins as monomers, which is typically divided into general synthet...
Global and China Carbon Fiber Industry Report, 2021-2026
Carbon fiber is a kind of inorganic high performance fiber (with carbon content higher than 90%) converted from organic fiber through heat treatment. As a new material with good mechanical properties,...
Global and China Dissolving Pulp Industry Report, 2019-2025
In 2018, global dissolving pulp capacity outstripped 10 million tons and its output surged by 14.0% from a year ago to 7.07 million tons, roughly 70% of the capacity. China, as a key supplier of disso...
Global and China 1, 4-butanediol (BDO) Industry Report, 2019-2025
1,4-butanediol (BDO), an essential organic and fine chemical material, finds wide application in pharmaceuticals, chemicals, textile and household chemicals.
As of the end of 2018, the global BDO cap...
Global and China Carbon Fiber and CFRP Industry Report, 2019-2025
Among the world’s three major high performance fibers, carbon fiber features the highest strength and the highest specific modulus. It is widely used in such fields as aerospace, sports and leisure.
...
Global and China Natural Rubber Industry Report, 2019-2025
In 2018, global natural rubber industry continued remained at low ebb, as a result of economic fundamentals. Global natural rubber price presented a choppy downtrend and repeatedly hit a record low in...
Global and China Ultra High Molecular Weight Polyethylene (UHMWPE) Industry Report, 2019-2025
Ultra high molecular weight polyethylene (UHMWPE), a kind of linear polyethylene with relative molecular weight of above 1.5 million used as an engineering thermoplastic with excellent comprehensive p...
China Polyether Monomer Industry Report, 2019-2025
China has seen real estate boom and issued a raft of policies for continuous efforts in improving weak links in infrastructure sector over the years. Financial funds of RMB1,663.2 billion should be al...
Global and China Viscose Fiber Industry Report, 2019-2025
Over the recent years, the developed countries like the United States, Japan and EU members have withdrawn from the viscose fiber industry due to environmental factor and so forth, while the viscose f...
Global and China Synthetic Rubber (BR, SBR, EPR, IIR, NBR, Butadiene, Styrene, Rubber Additive) Industry Report, 2018-2023
In 2018, China boasted a total synthetic rubber capacity of roughly 6,667kt/a, including 130kt/a new effective capacity. Considering capacity adjustment, China’s capacity of seven synthetic rubbers (B...
Global and China Dissolving Pulp Industry Report, 2018-2022
With the commissioning of new dissolving pulp projects, the global dissolving pulp capacity had been up to about 8,000 kt by the end of 2017. It is worth noticing that the top six producers including ...
Global and China Carbon Fiber and CFRP Industry Report, 2018-2022
As a new generation of reinforced fiber boasting intrinsic properties of carbon material and excellent processability of textile fiber, carbon fiber is the one with the highest specific strength and s...
Global and China Ultra High Molecular Weight Polyethylene (UHMWPE) Industry Report, 2017-2021
Ultra High Molecular Weight Polyethylene (UHMWPE), a kind of linear polyethylene with relative molecular weight of above 1.5 million and an engineering thermoplastic with excellent comprehensive prope...
Global and China Aramid Fiber Industry Report, 2017-2021
Global aramid fiber output totaled 115kt with capacity utilization of 76.0% in 2016. As industries like environmental protection and military develop, the output is expected to rise to 138kt and capac...
Global and China Natural Rubber Industry Report, 2017-2021
In 2016, the global natural rubber output edged up 1.1% year on year to 12.4 million tons, and the consumption rose by 3.8% year on year to 12.6 million tons, indicating the gap of 200,000 tons betwee...
China Synthetic Rubber Industry Report, 2017-2021
Synthetic rubber is one of important strategic materials, mainly used in tyres and other industries. In 2016, the global output and consumption of synthetic rubber reached 14.822 million tons and 14.9...
Global and China 1,4-butanediol (BDO) Industry Report, 2017-2021
1,4-butanediol (BDO) is a key raw material for organic and fine chemicals, capable of generating various derivatives like THF, PTMEG and GBL. BDO and its derivatives find wide application in PBT plast...
Global and China Ethylene Oxide (EO) Industry Report, 2017-2021
Ethylene oxide (EO) is one of the major derivatives of the ethylene industry. Featured with special reactivity, it can generate a series of fine chemical products for a wide range of applications.
In...