Global and China Acrylic Acid and Esters Industry Report, 2013-2016
-
June 2014
- Hard Copy
- USD
$2,600
-
- Pages:118
- Single User License
(PDF Unprintable)
- USD
$2,450
-
- Code:
CYH028
- Enterprise-wide License
(PDF Printable & Editable)
- USD
$3,800
-
- Hard Copy + Single User License
- USD
$2,800
-
Acrylic acid & esters is the general term for acrylic acid (AA) and acrylic esters (AE), wherein, AE mainly refers to common acrylic esters (CAE), inclusive of methyl acrylate (MA), ethyl acrylate (EA), butyl acrylate (BA), ethyl hexyl acrylate (EHA), etc..
Impacted by the weak chemical industry and other factors, the global capacity of both crude acrylic acid (CAA) and common acrylic esters (CAE) presented a downward trend in 2013, with year-on-year growth rates up to 5.7% and 5.8%, which fell by 5.9 percentage points and 13.9 percentage points from 2012, respectively.
As the world's largest producer of AA & AE, China contributed 30.8% (1,932 kt/a) and 32.3% (1,950 kt/a) to the global CAA and CAE capacity respectively in 2013. It is expected that by the end of 2016, its CAA and CAE capacities are expected to reach 3,520 kt/a and 3,730 kt/a, separately.
Super absorbent polymer (SAP), paint and adhesive are major downstream markets for AA & AE in China. In 2013, 68% of China’s aggregate demand for AA & AE came from them.
The report mainly covers the followings:
 Supply & demand, competitive landscape, geographical distribution, etc. of the global AA & AE industry;
Supply & demand, import & export, competition pattern, prices, etc. of Chinese AA & AE industry;
Development of propylene, SAP, paint and adhesives;
Operation and development in China of four global AA & AE enterprises such as BASF, Dow Chemical and Arkema;
Operation and development strategies of eight Chinese AA & AE enterprises including SunVic Chemical Holdings Limited, Shanghai Huayi Acrylic Acid Co., Ltd. and Zhejiang Satellite Petrochemical Co., Ltd.
BASF: The largest AA & AE manufacturer in the world contributed 19.0% and 20.8% of the global CAA and CAE capacity respectively in 2013. In May 2014, BASF's new 160 kt/a Acrylic Acid Project in Nanjing, China went into operation. Meanwhile, it is working on the 160 kt/a Acrylic Acid Project (scheduled to be put into operation at the end of 2014) in Brazil. By the end of 2014, BASF’s acrylic acid capacity is expected to attain 1,510 kt/a.
Arkema: As the world's third-largest AA & AE manufacturer, Arkema in 2014 announced that it would cooperate with the Chinese acrylic acid giant – SunVic Chemical to establish a joint venture dubbed Sunke (controlled by Arkema), which was to take over SunVic Chemical's acrylic acid production base in Taixing. The third 160 kt/a acrylic acid production line of Taixing Base is scheduled to go into operation in the first quarter of 2015, by then Arkema will boast acrylic acid capacity of 320 kt/a in China.
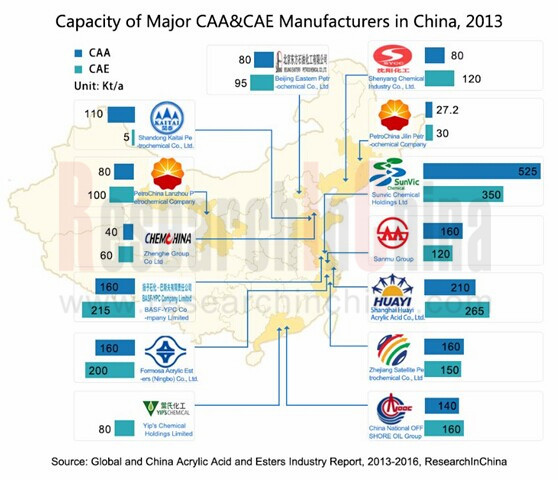
SunVic Chemical: The largest AA & AE manufacturer in China shared 27.2% and 17.9% of China’s CAA and CAE capacity respectively in 2013.
Shanghai Huayi Acrylic Acid: The second largest CAA & CAE manufacturer in China, with CAA & CAE capacities amounting to 210 kt/a and 265 kt/a in 2013, respectively. In 2014, the company is actively promoting its 320,000 tons/a AA & AE Project (located in Shanghai Chemical Industry Zone) which is implemented by two phases, of which, the Phase I Project (including 160 kt/a AA device, 160 kt/a BA, 84 kt/a GAA and 33.3 kt/a SAP) was commenced at the end of October 2013 and would go into operation in 2015 as planned.
1. Acrylic Acid (AA) & Acrylic Ester (AE)
1.1 Definition
1.2 Production Technology
1.3 Industry Chain
2. Global AA&AE Market
2.1 Supply
2.2 Demand
2.3 Enterprise Pattern
2.3.1 Crude Acrylic Acid (CAA)
2.3.2 Common Acrylic Ester (CAE)
2.4 Regional Distribution
3. China AA&AE Market
3.1 Supply
3.1.1 Capacity
3.1.2 Output
3.2 Demand
3.2.1 Consumption Structure
3.2.2 Consumption Volume
3.3 Import & Export
3.4 Competition Pattern
3.5 Price
4. Upstream-Downstream Industries of AA&AE
4.1 Propylene
4.1.1 Supply
4.1.2 Demand
4.1.3 Competition Pattern
4.1.4 Price
4.1.5 Trends
4.2 Super Absorbent Polymer (SAP)
4.2.1 Supply
4.2.2 Demand
4.2.3 Competition Pattern
4.2.4 Trends
4.3 Paint
4.3.1 Supply
4.3.2 Demand
4.3.3 Trends
4.4 Adhesive
4.4.1 Supply
4.4.2 Demand
4.4.3 Product Structure
4.4.4 Competition Pattern
4.4.5 Trends
5. Global Key AA&AE Companies
5.1 BASF
5.1.1 Profile
5.1.2 Operation
5.1.3 Revenue Structure
5.1.4 R&D and Investment
5.1.5 AA&AE Business
5.1.6 Development in China
5.2 DOW
5.2.1 Profile
5.2.2 Operation
5.2.3 Revenue Structure
5.2.4 Gross Profit
5.2.5 R&D
5.2.6 AA&AE Business
5.2.7 Development in China
5.3 Arkema
5.3.1 Profile
5.3.2 Operation
5.3.3 Revenue Structure
5.3.4 R&D and Projects under Construction
5.3.5 AA&AE Business
5.3.6 Development in China
5.3.7 Development Strategy
5.4 NIPPON SHOKUBAI
5.4.1 Profile
5.4.2 Operation
5.4.3 Revenue Structure
5.4.4 AA&AE Related Business
5.4.5 Development in China
5.4.6 Development Strategy
6. Key Chinese AA&AE Companies
6.1 Formosa Plastics Corporation
6.1.1 Profile
6.1.2 Operation
6.1.3 Revenue Structure
6.1.4 Gross Profit
6.1.5 R&D
6.1.6 AA&AE Business
6.2 Shenyang Chemical Co., Ltd (000698)
6.2.1 Profile
6.2.2 Operation
6.2.3 Revenue Structure
6.2.4 Gross Margin
6.2.5 R&D and Projects under Construction
6.2.6 AA&AE Business
6.2.7 Development Prospect
6.3 Zhejiang Satellite Petrochemical Co., Ltd (002648)
6.3.1 Profile
6.3.2 Operation
6.3.3 Revenue Structure
6.3.4 Gross Margin
6.3.5 R&D and Projects under Construction
6.3.6 AA&AE Business
6.3.7 Development Prospects
6.4 SunVic Chemical Holdings Limited (A7S)
6.4.1 Profile
6.4.2 Operation
6.4.3 Revenue Structure
6.4.4 Gross Profit
6.4.5 AA&AE Business
6.4.6 Development Prospect
6.5 Shandong Kaitai Petrochemical Co., Ltd.
6.5.1 Profile
6.5.2 Operation
6.5.3 Revenue Structure
6.5.4 Projects under Construction
6.5.5 AA&AE Business
6.6 BASF-YPC Company Limited
6.6.1 Profile
6.6.2 Operation
6.6.3 AA&AE Business
6.7 Shanghai Huayi Acrylic Acid Co., Ltd.
6.7.1 Profile
6.7.2 Operation
6.7.3 AA&AE Business
6.7.4 AA&AE Project Planning
6.8 Beijing Eastern Petrochemical Co.,Ltd
6.8.1 Profile
6.8.2 AA&AE Business
7. Conclusion and Forecast
7.1 Conclusion
7.2 Forecast
CAE Properties by Type
Upstream and Downstream Industry Chain of AA&AE
Global CAA and CAE Capacity, 2007-2014
New Capacity and Operation Time of Some Global AA Enterprises, 2014-2016E
Global AA&AE Consumption Structure by Product
Capacity Structure of Global Top 10 CAA Enterprises, 2013-2014
Capacity Structure of Global Top 10 CAE Enterprises, 2013-2014
Global AA&AE Capacity by Country/Region, 2013
China’s CAA Capacity and YoY Growth, 2006-2014
China’s CAE Capacity and YoY Growth, 2010-2014
China’s CAE Capacity Structure by Product, 2010-2016E
China’s AA&AE Output, 2008-2014
China's AA&AE Consumption Structure by Product
China’s Apparent AA Consumption, 2008-2013
China’s Apparent AE Consumption, 2008-2013
China’s AA&AE Import and Export Volume by Product, 2008-2014
China’s AA&AE Import Price by Product, 2008-2014
China’s AA&AE Export Price by Product, 2008-2014
China's AA&AE Capacity by Enterprise/Product, 2013
Expansion Projects of China's Major AA&AE Manufacturers by Product, 2014-2016E
Monthly Average Price of Chinese AA&AE Market by Product, 2010-2014
China’s Propylene Output and YoY Growth, 2006-2016E
China’s Propylene Output, Import & Export and Apparent Consumption, 2006-2013
China’s Propylene Capacity Breakdown by Enterprise, 2013
Average Propylene Price in China, 2008-2014
Global SAP Capacity and YoY Growth, 2008-2014
Global SAP Capacity Structure by Country / Region, 2013
China’s SAP Demand Structure by Product
Global SAP Capacity and Market Share by Top Enterprises, 2013
China’s SAP Capacity by Enterprise, 2013-2014
China’s New SAP Capacity by Enterprise, 2014-2016E
China’s Paint Output and YoY Growth, 2006-2014
China’s Paint Output Structure by Type, 2012
China’s Paint Output, Import & Export Volume and Apparent Consumption, 2006-2013
China’s Powder Paint Demand Structure by Purpose
Future Development of China Paint Industry
Classification and Properties of Adhesives in China, by Composition
China’s Adhesive Output and YoY Growth, 2006-2014
China’s Adhesive Sales and YoY Growth, 2006-2014
China’s Adhesive Consumption Structure by Purpose, 2011-2013
China’s Adhesive Sales Volume and Structure by Product, 2012
Core Products, Revenue and Downstream Application of Major Structural Adhesive Enterprises in China, 2013
BASF’s Structure by Business
BASF’s Sales and Net Income, 2008-2013
BASF’s Sales by Business, 2012-2013
BASF’s Sales Breakdown and Percentage by Region, 2010-2013
BASF’s R&D Expenses and % of Revenue, 2008-2013
BASF’S R&D Expenses Structure by Segment, 2013
Capacity Breakdown of BASF’s Chemical Business by Product / Region, 2013
BASF’s AA Capacity, 2009-2015E
Completion Time and Capacity of BASF’s AA&AE Related Projects under Construction, 2013
BASF’s Main Subsidiaries in China, by Region, 2014
BASF’s Sales in China and YoY Growth Rate, 2007-2013
BASF’s Major Completed and Ongoing Projects in China, 2014
Net Sales and Net Income of Dow Chemical, 2009-2014
Operation Rate of Dow Chemical, 2008-2013
Sales Breakdown of Dow Chemical by Department, 2010-2013
Sales Structure of Dow Chemical by Region, 2009-2013
Gross Profit and YoY Growth of Dow Chemical, 2009-2013
R&D Expenses and % of Total Revenue of Dow Chemical, 2008-2013
Patents of Dow Chemical by Segment, as of end-2013
AA&AE Capacity Breakdown of Dow Chemical by Country, 2013
Sales Structure of Dow Chemical’s Coatings and Infrastructure Solutions Business by Segment, 2013
Product Distribution of Arkema by Department, 2013
Sales and Net Income of Arkema, 2009-2014
Sales Structure of Arkema by Department/Business, 2013
Revenue Structure of Arkema by Region, 2010-2013
Key Constructions in Process of Arkema, 2014
Capacity of Arkema by Country, 2013
AA&AE Business Revenue and YoY Growth of Arkema, 2009-2013
Arkema’s Major Construction Projects in China, 2010-2014
Business Development Target of Arkema, 2006-2020
Product Distribution of NIPPON SHOKUBAI by Segment
Sales and Net Income of NIPPON SHOKUBAI, FY2010-FY2014
Sales of NIPPON SHOKUBAI by Segment, FY2010-FY2014
Sales Structure of NIPPON SHOKUBAI by Country/Region, FY2009-FY2014
AA and SAP Capacity of NIPPON SHOKUBAI by Country, 2014
Capacity Breakdown of Formosa Plastics Corporation by Product, 2009-2014
Revenue and Net Income of Formosa Plastics Corporation, 2009-2014
Sales Structure of Formosa Plastics Corporation by Product, 2009-2013
Formosa Plastics Corporation’s Revenue Breakdown and Percentage by Region, 2012-2013
Gross Profit and Gross Margin of Formosa Plastics Corporation, 2009-2014
R&D Costs and % of Total Revenue of Formosa Plastics Corporation, 2010-2014
Revenue and YoY Growth of AA&AE Products of Formosa Plastics Corporation, 2008-2013
AA&AE Sales Structure of Formosa Plastics Corporation by Product, 2013
Sales Volume Breakdown of AA&AE Business of Formosa Plastics Corporation by Product, 2009-2013
Capacity, Output, Sales Volume, Capacity Utilization and Sales-Output Ratio of AE Products of Formosa Plastics Corporation, 2009-2013
AA&AE Capacity of Formosa Ningbo by Product, 2012-2014
Subsidiary Distribution of Shenyang Chemical, 2013
Capacity of Shenyang Chemical by Product, at the End of 2013
Revenue and Net Income of Shenyang Chemical, 2009-2014
Shenyang Chemical’s Revenue Breakdown and Percentage by Product, 2010-2013
Gross Margin of Shenyang Chemical by Product, 2008-2013
R&D Costs and % of Total Revenue of Shenyang Chemical, 2008-2013
Projects under Construction of Shenyang Chemical by the End of 2013
AA&AE Capacity of Shenyang Chemical by Product, 2013
AA&AE Output and Sales Volume of Shenyang Chemical, 2009-2013
AA&AE Revenue and YoY Growth of Shenyang Chemical, 2009-2013
Revenue and Net Income of Shenyang Chemical, 2012-2016E
Capacity of Zhejiang Satellite Petrochemical by Product, 2008-2014
Revenue and Net Income of Zhejiang Satellite Petrochemical, 2009-2014
Revenue of Zhejiang Satellite Petrochemical by Product, 2008-2013
Revenue of Zhejiang Satellite Petrochemical by Region, 2008-2013
Gross Margin of Zhejiang Satellite Petrochemical by Product, 2008-2013
R&D Costs and % of Revenue of Zhejiang Satellite Petrochemical, 2008-2013
Key Projects under Construction of Zhejiang Satellite Petrochemical as of the End of 2013
AA&AE Revenue and YoY Growth of Zhejiang Satellite Petrochemical, 2008-2013
AA&AE Output, Sales Volume and Sales-output Ratio of Zhejiang Satellite Petrochemical by Product, 2008-2011 (10 kilotons)
AA&AE Capacity of Zhejiang Satellite Petrochemical by Product, 2008-2015E
Revenue and Net Income of Zhejiang Satellite Petrochemical, 2012-2016E
Subsidiaries of SunVic Chemical, 2014
Revenue and Net Income of SunVic Chemical, 2009-2014
Revenue of SunVic Chemical by Product, 2008-2013
Revenue of SunVic Chemical by Region, 2010-2013
Gross Profit and YoY Growth of SunVic Chemical, 2009-2014
Revenue and YoY Growth of AA&AE Products of SunVic Chemical, 2008-2013
Sales Volume and YoY Growth of AA&AE Products of SunVic Chemical, 2008-2013
AA&AE Capacity of SunVic Chemical by Product, 2010-2013
Revenue, Net Income and YoY Growth of SunVic Chemical, 2012-2016E
Subsidiary Distribution of Shandong Kaitai Petrochemical
Revenue and Net Income of Shandong Kaitai Petrochemical, 2009-2012
Revenue of Shandong Kaitai Petrochemical by Product, 2009-2012
AA&AE Capacity of Shandong Kaitai Petrochemical by Product, as of the End of 2013
AA&AE Output and Sales-Output Ratio of Shandong Kaitai Petrochemical, 2009-2012
AA&AE Sales Volume of Shandong Kaitai Petrochemical by Product, 2009-2012
Capacity of BASF-YPC by Product, 2014
Sales and YoY Growth of BASF-YPC, 2007-2013
AA&AE Capacity of Acrylic Acid & Esters by Product, 2013-2014
Revenue and Net Income of Shanghai Huayi Acrylic Acid, 2009-2013
AA&AE Output of Shanghai Huayi Acrylic Acid, 2009-2013
AA&AE Capacity of Shanghai Huayi Acrylic Acid by Product, in Early 2014
AA&AE Capacity of Beijing Eastern Petrochemical by Product, 2013
China’s CAA Capacity and Structure by Enterprise, 2013-2014
China’s CAE Capacity and Structure by Enterprise, 2013-2014
China’s CAA capacity and YoY Growth, 2012-2016E
China’s CAE capacity and YoY Growth, 2012-2016E
Future Development of Global AA&AE Business
Global and China Synthetic Rubber Industry Report, 2021-2027
Synthetic rubber is a polymer product made of coal, petroleum and natural gas as main raw materials and polymerized with dienes and olefins as monomers, which is typically divided into general synthet...
Global and China Carbon Fiber Industry Report, 2021-2026
Carbon fiber is a kind of inorganic high performance fiber (with carbon content higher than 90%) converted from organic fiber through heat treatment. As a new material with good mechanical properties,...
Global and China Dissolving Pulp Industry Report, 2019-2025
In 2018, global dissolving pulp capacity outstripped 10 million tons and its output surged by 14.0% from a year ago to 7.07 million tons, roughly 70% of the capacity. China, as a key supplier of disso...
Global and China 1, 4-butanediol (BDO) Industry Report, 2019-2025
1,4-butanediol (BDO), an essential organic and fine chemical material, finds wide application in pharmaceuticals, chemicals, textile and household chemicals.
As of the end of 2018, the global BDO cap...
Global and China Carbon Fiber and CFRP Industry Report, 2019-2025
Among the world’s three major high performance fibers, carbon fiber features the highest strength and the highest specific modulus. It is widely used in such fields as aerospace, sports and leisure.
...
Global and China Natural Rubber Industry Report, 2019-2025
In 2018, global natural rubber industry continued remained at low ebb, as a result of economic fundamentals. Global natural rubber price presented a choppy downtrend and repeatedly hit a record low in...
Global and China Ultra High Molecular Weight Polyethylene (UHMWPE) Industry Report, 2019-2025
Ultra high molecular weight polyethylene (UHMWPE), a kind of linear polyethylene with relative molecular weight of above 1.5 million used as an engineering thermoplastic with excellent comprehensive p...
China Polyether Monomer Industry Report, 2019-2025
China has seen real estate boom and issued a raft of policies for continuous efforts in improving weak links in infrastructure sector over the years. Financial funds of RMB1,663.2 billion should be al...
Global and China Viscose Fiber Industry Report, 2019-2025
Over the recent years, the developed countries like the United States, Japan and EU members have withdrawn from the viscose fiber industry due to environmental factor and so forth, while the viscose f...
Global and China Synthetic Rubber (BR, SBR, EPR, IIR, NBR, Butadiene, Styrene, Rubber Additive) Industry Report, 2018-2023
In 2018, China boasted a total synthetic rubber capacity of roughly 6,667kt/a, including 130kt/a new effective capacity. Considering capacity adjustment, China’s capacity of seven synthetic rubbers (B...
Global and China Dissolving Pulp Industry Report, 2018-2022
With the commissioning of new dissolving pulp projects, the global dissolving pulp capacity had been up to about 8,000 kt by the end of 2017. It is worth noticing that the top six producers including ...
Global and China Carbon Fiber and CFRP Industry Report, 2018-2022
As a new generation of reinforced fiber boasting intrinsic properties of carbon material and excellent processability of textile fiber, carbon fiber is the one with the highest specific strength and s...
Global and China Ultra High Molecular Weight Polyethylene (UHMWPE) Industry Report, 2017-2021
Ultra High Molecular Weight Polyethylene (UHMWPE), a kind of linear polyethylene with relative molecular weight of above 1.5 million and an engineering thermoplastic with excellent comprehensive prope...
Global and China Aramid Fiber Industry Report, 2017-2021
Global aramid fiber output totaled 115kt with capacity utilization of 76.0% in 2016. As industries like environmental protection and military develop, the output is expected to rise to 138kt and capac...
Global and China Natural Rubber Industry Report, 2017-2021
In 2016, the global natural rubber output edged up 1.1% year on year to 12.4 million tons, and the consumption rose by 3.8% year on year to 12.6 million tons, indicating the gap of 200,000 tons betwee...
China Synthetic Rubber Industry Report, 2017-2021
Synthetic rubber is one of important strategic materials, mainly used in tyres and other industries. In 2016, the global output and consumption of synthetic rubber reached 14.822 million tons and 14.9...
Global and China 1,4-butanediol (BDO) Industry Report, 2017-2021
1,4-butanediol (BDO) is a key raw material for organic and fine chemicals, capable of generating various derivatives like THF, PTMEG and GBL. BDO and its derivatives find wide application in PBT plast...
Global and China Ethylene Oxide (EO) Industry Report, 2017-2021
Ethylene oxide (EO) is one of the major derivatives of the ethylene industry. Featured with special reactivity, it can generate a series of fine chemical products for a wide range of applications.
In...