Global and China Electronic Chemicals Industry Report, 2014-2017
-
Aug.2014
- Hard Copy
- USD
$2,450
-
- Pages:100
- Single User License
(PDF Unprintable)
- USD
$2,300
-
- Code:
HK047
- Enterprise-wide License
(PDF Printable & Editable)
- USD
$3,450
-
- Hard Copy + Single User License
- USD
$2,650
-
Electronic chemicals refer to a variety of chemicals and materials used in electronic components, printed circuit boards, consumer electronics and other industrial products. This report focuses on analyzing photoresist & its special chemicals and capacitor chemicals as well as maleic anhydride derivatives used in printed circuit boards, flat panel displays and semiconductors.
1 Photoresist
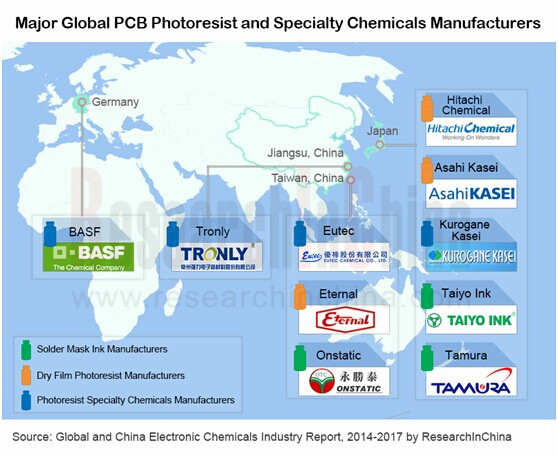
Photoresist is mainly used for fine graphics processing in PCB, LCD, semiconductor and other areas. In 2013, the global photoresist market scale reached approximately RMB40 billion, mainly held by Japanese, American, South Korean and Taiwanese enterprises. Take PCB photoresist market for example: in 2013, the combined market share of Asahi Kasei, Hitachi Chemical and Taiwan Eternal Chemical in the PCB dry film photoresist market was more than 80%; Taiyo Ink enjoyed a share of more than 50% in the PCB solder mask ink market.
China photoresist market is growing rapidly. In 2013, the share of China PCB photoresist market size in the global total rose to 64.3%; while the share of China LCD and semiconductor photoresist market scale was less than one-third of the world’s total, and the development space is still large. China photoresist market is almost occupied by foreign companies; market share of Chinese counterparts was less than 10%, mainly including photoresist special chemical manufacturer Changzhou Tronly New Electronic Materials Co., Ltd., semiconductor g-line/i-line photoresist producer Beijing Kempur Microelectronics.Inc.
2 Capacitor chemicals
Capacitor chemicals are one of key raw materials to produce aluminum electrolytic capacitors, solid polymer capacitors and supercapacitors. In 2013, the global capacitor chemicals market size approximated RMB7 billion, with products mainly produced by Japanese, European, American and Chinese manufacturers, such as Sanyo Chemical Industries, Honeywell, and Shenzhen Capchem Technology.
China aluminum electrolytic capacitor chemicals industry is fairly mature, with its market scale making up about 50% of the global total in 2013, and chiefly dominated by Shenzhen Capchem Technology and foreign-funded enterprises.
3 Maleic Anhydride Derivatives
Maleic anhydride derivatives are mainly used for the packaging of electronic components. In 2013, global demand for maleic anhydride derivatives reached approximately 250 kt, the varieties that have larger demand are Methyl tetrahydrophthalic anhydride and tetrahydrophthalic anhydride, main producers of which include Italian Polynt, New Japan Chemical, Hitachi Chemical and so on.
China maleic anhydride derivatives industry can basically achieve self-sufficiency, the demand of which accounted for about half of the world's demand in 2013. The main producers consist of Puyang Huicheng Electronic Material Co., Ltd, Jiaxing Orient Chemical Factory, and Jiaxing Qingyang Chemical Co., Ltd.
Global and China Electronic Chemicals Industry Report, 2004-2017 by ResearchInChina sheds light on the following:
 Size and competition pattern of Global and China photoresist and special chemicals market, and development forecast for 2014-2017;
Size and competition pattern of Global and China capacitor chemicals market, and development forecast for 2014-2017;
Size and competition pattern of Global and China maleic anhydride derivatives market and development forecast for 2014-2017;
Operational analysis, electronic chemicals business analysis, development and forecast of 18 Global and Chinese electronic chemicals manufacturers.
1 Overview of Electronic Chemicals
1.1 Definition
1.2 Industry Features
1.3 Industry Chain
2 Photoresist and Special Chemicals
2.1 Overview
2.2 PCB Photoresist
2.2.1 Global Market
2.2.2 Chinese Market
2.3 LCD Photoresist
2.3.1 Global Market
2.3.2 Chinese Market
2.4 Semiconductor Photoresist
2.4.1 Global Market
2.4.2 Chinese Market
3 Capacitor Chemicals
3.1 Overview
3.2 Aluminum Electrolytic Capacitor Chemicals
3.2.1 Global Market
3.2.2 Chinese Market
3.3 Solid Polymer Capacitor Chemicals
3.4 Supercapacitor Electrolyte
4 Maleic Anhydride Derivatives
4.1 Overview
4.2 Global Market
4.3 Chinese Market
4.4 Competition Pattern
5 Major Overseas Electronic Chemicals Enterprises
5.1 Taiwan Eternal Chemical
5.1.1 Profile
5.1.2 Operation
5.1.3 Electronic Chemicals Business
5.2 Asahi Kasei
5.2.1 Profile
5.2.2 Operation
5.2.3 Electronic Chemicals Business
5.3 Hitachi Chemical
5.3.1 Profile
5.3.2 Operation
5.3.3 Electronic Chemicals Business
5.4 Taiyo Ink
5.4.1 Profile
5.4.2 Operation
5.4.3 Electronic Chemicals Business
5.4.4 Taiwan Onstatic Technology
5.5 BASF
5.5.1 Profile
5.5.2 Operation
5.5.3 Electronic Chemicals Business
5.6 Sanyo Kasei
5.6.1 Profile
5.6.2 Operation
5.6.3 Electronic Chemicals Business
5.7 Honeywell
5.7.1 Profile
5.7.2 Operation
5.5.3 Electronic Chemicals Business
5.8 New Japan Chemical
5.8.1 Profile
5.8.2 Operation
5.8.3 Electronic Chemicals Business
6 Major Enterprises in Electronic Chemicals Industry in Mainland China
6.1 Shenzhen Capchem Technology
6.1.1 Profile
6.1.2 Operation
6.1.3 Revenue Structure
6.1.4 Gross Margin
6.1.5 R & D
6.1.6 Electronic Chemicals Business
6.1.7 Forecast and Outlook
6.2 Shanghai Sinyang Semiconductor Materials
6.2.1 Profile
6.2.2 Operation
6.2.3 Revenue Structure
6.2.4 Gross Margin
6.2.5 R & D
6.2.6 Customers
6.2.7 Electronic Chemicals Business
6.2.8 Forecast and Outlook
6.3 Changzhou Tronly New Electronic Materials
6.3.1 Profile
6.3.2 Operation
6.3.3 Revenue Structure
6.3.4 Gross Margin
6.3.5 R & D
6.3.6 Customers and Suppliers
6.3.7 Electronic Chemicals Business
6.3.8 Forecast and Outlook
6.4 Puyang Huicheng Electronic Material
6.4.1 Profile
6.4.2 Operation
6.4.3 Revenue Structure
6.4.4 Gross Margin
6.4.5 R & D
6.4.6 Customers and Suppliers
6.4.7 Electronic Chemicals Business
6.4.8 Forecast and Outlook
6.5 Other Companies
6.5.1 Shenzhen Rongda Photosensitive Science and Technology
6.5.2 Beijing Kempur Microelectronics
6.5.3 Suzhou Ruihong Electronic Chemicals
6.5.4 Nantong Hengxing Electronic Material
6.5.5 Jiaxing Orient Chemical Factory
6.5.6 Jiaxing Qingyang Chemical
7 Summary and Forecast
7.1 Summary of Enterprises
7.2 Summary of Market
7.3 Development Forecast
7.3.1 Photoresist
7.3.2 Capacitor Chemicals
7.3.2 Maleic Anhydride Derivatives
Characteristics of Electronic Chemicals Industry
Electronic Chemicals Industry Chain
Introduction to Photoresist Special Chemicals
Applications and Categories of Photoresist
Photoresist Industry Chain
Global PCB Photoresist Market Size by Product, 2013
Global PCB Photoresist Market Competition Pattern, 2013
Major Enterprises in Global PCB Photoresist Special Chemicals Market, 2013
China PCB Photoresist Market Size by Product, 2013
Major Enterprises in China PCB Photoresist And Special Chemicals Market, 2013
PCB Photoresist Projects Proposed and under Construction in China, 2014
Global LCD Photoresist Market Size by Product, 2013
Global LCD Photoresist Market Competition Pattern, 2013
Major Enterprises in global LCD Photoresist Special Chemicals Market, 2013
Classification and Main Applications of Semiconductor Photoresist
Global Semiconductor Photoresist Market Size by Product, 2013
Major Enterprises in Global Semiconductor Photoresist Market, 2013
China Semiconductor Photoresist Market Size and Competition Pattern, 2013
Capacitor Chemicals Industry Chain
Operating Revenue and Growth Rate of China Capacitor and Auxiliary Equipment Manufacturing Industry, 2003-2013
Global Aluminum Electrolytic Capacitor Market Size and Growth Rate, 2005-2013
Global Aluminum Electrolytic Capacitor Chemicals Market Size, 2005-2013
Major Global Aluminum Electrolytic Capacitor Chemicals Enterprises, 2013
China Aluminum Electrolytic Capacitor Chemicals Market Size, 2013
Major Aluminum Electrolytic Capacitor Chemicals Enterprises in China, 2013
Global Solid Polymer Capacitor Chemicals Market Size, 2013
Major Enterprises in Global Solid Polymer Capacitor Industry, 2013
Global Supercapacitor Electrolyte Market Size, 2013
Chinese Supercapacitor Electrolyte Market Size, 2013
Competition Pattern of Global and Chinese Supercapacitor Electrolyte Industry, 2013
Maleic Anhydride Derivative Industry Chain
Global Demand and Its Growth Rate of Maleic Anhydride Derivatives, 2009-2013
Demand Structure of Global Maleic Anhydride Derivative Products, 2013
China's Demand and its Growth Rate of Maleic Anhydride Derivatives, 2009-2013
China's Demand for Main Varieties of Maleic Anhydride Derivatives and Their Proportions of the Global Demand, 2013
Demand Structure of Chinese Maleic Anhydride Derivative Products, 2013
Major Global and Chinese Maleic Anhydride Derivative Enterprises, 2013
Business Divisions of Taiwan Eternal Chemical
Revenue and Growth Rate of Taiwan Eternal Chemical, 2009-2013
Revenue Structure of Taiwan Eternal Chemical by Sector, 2013
Revenue Structure of Taiwan Eternal Chemical by Region, 2013
Photoresist Business Related Subsidiaries of Taiwan Eternal Chemical, 2013
Main Business of Nine Business Companies of Asahi Kasei
Net Sales and Net Income of Asahi Kasei, FY2009-FY2013
Net Sales Structure of Asahi Kasei, by Sector, FY2011-FY2013
Net Sales and Operating Profit of Asahi Kasei's Electronics Sector, FY2011-FY2013
Net Sales Structure of Asahi Kasei's Electronics Sector, FY2012-FY2013
Main Dry Film Photoresist Production Plants of Asahi Kasei, 2013
Net Sales and Net Income of Hitachi Chemical, FY2009-FY2013
Net Sales Structure of Hitachi Chemical, by Sector, FY2011-FY2013
Net Sales Structure of Hitachi Chemical, by Region, FY2011-FY2013 Electronic Chemicals Products of Hitachi Chemical Photoresist Business
Related Subsidiaries in China of Hitachi Chemical, 2013
Net Sales and Net Income of Taiyo Holdings, FY2009-FY2013
Net Sales Structure of Taiyo Holdings, by Application, FY2012-FY2013
Net Sales Structure of Taiyo Holdings, by Region, FY2011-FY2013
Worldwide Subsidiaries of Taiyo Ink, 2013
BASF's Business Divisions and Their Main Business
Sales and Net Income of BASF, 2009-2013
Sales Structure of BASF by Sector, 2012-2013
Sales Structure of BASF by Region, 2012-2013
Net Sales and Net Income of Sanyo Chemical, 2009-2013
Net Sales Structure of Sanyo Chemical, by Sector, FY2011-FY2013
Net Sales Structure of Sanyo Chemical, by Region, FY2011-FY2013
Main Products of Sanyo Chemical Information & Electrical Sector
Sales and Profit of Sanyo Chemical Information & Electrical sector, FY2011-FY2013
Sanyo Chemical's Subsidiaries in China
Revenue and Net Income of Honeywell, 2009-2013
Revenue Structure of Honeywell by Sector, 2011-2013
Revenue Structure of Honeywell, by Region, 2011-2013
Revenue and Profit of Honeywell High Performance Materials Technology Sector, 2011-2013
Main Products and Their Classification of Honeywell High Performance Materials Technology Sector
Revenue Structure of Honeywell High Performance Materials Technology Sector, by Product, 2011-2013
Net Sales and Net Income of New Japan Chemical, FY2009-FY2013
Main Products of New Japan Chemical
Revenue and Net Income of Shenzhen Capchem Technology, 2009-2013
Revenue of Shenzhen Capchem Technology by Product, 2011-2013
Revenue Structure of Shenzhen Capchem Technology by Product, 2011-2013
Revenue of Shenzhen Capchem Technology by Region, 2011-2013
Revenue Structure of Shenzhen Capchem Technology by Region, 2011-2013
Gross Margin of Main Products of Shenzhen Capchem Technology, 2011-2013
R&D Costs and % of Total Revenue of Shenzhen Capchem Technology, 2011-2013
Output and Sales Volume of Shenzhen Capchem Technology, 2011-2013 Shenzhen Capchem Technology's Subsidiaries and Their Main Business, 2013
Revenue and Net Income of Shenzhen Capchem Technology, 2013
Main Electronic Chemicals of Shenzhen Capchem Technology and Their Development, 2013
Projects under Construction of Shenzhen Capchem Technology as of end of 2013
Revenue and Net Income of Shenzhen Capchem Technology, 2013-2017E
Revenue and Net Income of Shanghai Sinyang, 2009-2013
Revenue of Shanghai Sinyang by Product, 2011-2013
Revenue Structure of Shanghai Sinyang by Product, 2011-2013
Revenue of Shanghai Sinyang, by Region, 2011-2013
Revenue Structure of Shanghai Sinyang by Region, 2011-2013
Gross Margin of Main Products of Shanghai Sinyang, 2011-2013
Shanghai Sinyang's R&D Costs and % of Total Revenue, 2011-2013 Shanghai Sinyang’s Revenue from Top 5 Customers and % of Total Revenue, 2011-2013
Name List and Revenue Contribution of Shanghai Sinyang’s Top5 Customers, 2013
Output and Sales Volume of Shanghai Sinyang, 2011-2013
Projects under Construction of Shanghai Sinyang, 2013
Revenue and Net Income of Shanghai Sinyang, 2013-2017E
Revenue and Net Income of Changzhou Tronly, 2011-2013
Revenue of Changzhou Tronly by Product, 2011-2013
Revenue Structure of Changzhou Tronly by Product, 2011-2013
Revenue of Changzhou Tronly, by Application, 2011-2013
Revenue Structure of Changzhou Tronly, by Application, 2011-2013
Revenue of Changzhou Tronly, by Region, 2011-2013
Revenue Structure of Changzhou Tronly, by Region, 2011-2013
Gross Margin of Hit Products of Changzhou Tronly, 2011-2013
Changzhou Tronly's R&D Costs and % of Total Revenue, 2011-2013 Changzhou Tronly's Revenue from Top 5 Customers and % of Total Revenue, 2011-2013
Name List and Revenue Contribution of Changzhou Tronly’s Top5 Customers, 2013
Changzhou Tronly’s Procurement from Top 10 Suppliers and % of Total Procurement, 2011-2013
Name List and Procurement of Changzhou Tronly’s Top 10 Suppliers, 2013
Photoinitiator Capacity, Output and Operating Rate of Changzhou Tronly, 2011-2013
Photoresist Resin Capacity, Output and Operating Rate of Changzhou Tronly, 2011-2013
Changzhou Tronly's Output, Sales Volume and Sales-Output Ratio of Main Products, 2011-2013
Changzhou Tronly's Average Selling Price of Main Products, 2011-2013
Changzhou Tronly's Subsidiaries, 2013
Total Assets and Net Income of Changzhou Tronly's Subsidiaries, 2013
Proposed Projects of Changzhou Tronly, 2014
Revenue and Net Income of Changzhou Tronly, 2013-2017E
Revenue and Net Income of Puyang Huicheng, 2011-2013
Revenue of Puyang Huicheng, by Product, 2011-2013
Revenue Structure of Puyang Huicheng, by Product, 2011-2013
Revenue of Puyang Huicheng, by Region, 2011-2013
Revenue Structure of Puyang Huicheng, by Region, 2011-2013
Gross Margin of Main Products of Puyang Huicheng, 2011-2013
Puyang Huicheng's R&D Costs and % of Total Revenue, 2011-2013
Puyang Huicheng's Revenue from Top5 Customers and % of Total Revenue, 2011-2013
Name List and Revenue Contribution of Puyang Huicheng's Top5 Customers, 2013
Puyang Huicheng’s Procurement from Top 5 Suppliers and % of Total Procurement, 2011-2013
Name List and Procurement of Puyang Huicheng’s Top 5 Suppliers, 2013
Puyang Huicheng's Capacity, Output and Operating Rate of Main Products, 2011-2013
Puyang Huicheng's Output, Sales Volume and Sales-Output Ratio of Main Products, 2011-2013
Puyang Huicheng's Average Selling Price of Main Products, 2011-2013
Proposed Projects of Puyang Huicheng, 2014
Revenue and Net Income of Puyang Huicheng, 2013-2017E
Comparison between Revenue from Electronic Chemicals Business of Some Global Enterprises, 2013
Comparison between Global and China Photoresist Market Size by Product, 2013
Comparison between Global and China Capacitor Chemicals Market Size by Product, 2013
Comparison between Global and China Maleic Anhydride Derivatives Market Size by Product, 2013
Global Photoresist Market Size by Product, 2013-2017E
China Photoresist Market Size, by Product, 2013-2017E
Proportion of China Photoresist Market Size in Global Total, by Product, 2013-2017E
Global Capacitor Chemicals Market Size by Product, 2013-2017E
Chinese Capacitor Chemicals Market Size by Product, 2013-2017E
Proportion of China Capacitor Chemicals Market Size in Global Total by Product, 2013-2017E
Global Maleic Anhydride Derivative Market Size, by Product, 2013-2017E
China Maleic Anhydride Derivative Market Size, by Product, 2013-2017E
Proportion of China Maleic Anhydride Derivatives Market Size in Global Total, by Product, 2013-2017E
Global and China Synthetic Rubber Industry Report, 2021-2027
Synthetic rubber is a polymer product made of coal, petroleum and natural gas as main raw materials and polymerized with dienes and olefins as monomers, which is typically divided into general synthet...
Global and China Carbon Fiber Industry Report, 2021-2026
Carbon fiber is a kind of inorganic high performance fiber (with carbon content higher than 90%) converted from organic fiber through heat treatment. As a new material with good mechanical properties,...
Global and China Dissolving Pulp Industry Report, 2019-2025
In 2018, global dissolving pulp capacity outstripped 10 million tons and its output surged by 14.0% from a year ago to 7.07 million tons, roughly 70% of the capacity. China, as a key supplier of disso...
Global and China 1, 4-butanediol (BDO) Industry Report, 2019-2025
1,4-butanediol (BDO), an essential organic and fine chemical material, finds wide application in pharmaceuticals, chemicals, textile and household chemicals.
As of the end of 2018, the global BDO cap...
Global and China Carbon Fiber and CFRP Industry Report, 2019-2025
Among the world’s three major high performance fibers, carbon fiber features the highest strength and the highest specific modulus. It is widely used in such fields as aerospace, sports and leisure.
...
Global and China Natural Rubber Industry Report, 2019-2025
In 2018, global natural rubber industry continued remained at low ebb, as a result of economic fundamentals. Global natural rubber price presented a choppy downtrend and repeatedly hit a record low in...
Global and China Ultra High Molecular Weight Polyethylene (UHMWPE) Industry Report, 2019-2025
Ultra high molecular weight polyethylene (UHMWPE), a kind of linear polyethylene with relative molecular weight of above 1.5 million used as an engineering thermoplastic with excellent comprehensive p...
China Polyether Monomer Industry Report, 2019-2025
China has seen real estate boom and issued a raft of policies for continuous efforts in improving weak links in infrastructure sector over the years. Financial funds of RMB1,663.2 billion should be al...
Global and China Viscose Fiber Industry Report, 2019-2025
Over the recent years, the developed countries like the United States, Japan and EU members have withdrawn from the viscose fiber industry due to environmental factor and so forth, while the viscose f...
Global and China Synthetic Rubber (BR, SBR, EPR, IIR, NBR, Butadiene, Styrene, Rubber Additive) Industry Report, 2018-2023
In 2018, China boasted a total synthetic rubber capacity of roughly 6,667kt/a, including 130kt/a new effective capacity. Considering capacity adjustment, China’s capacity of seven synthetic rubbers (B...
Global and China Dissolving Pulp Industry Report, 2018-2022
With the commissioning of new dissolving pulp projects, the global dissolving pulp capacity had been up to about 8,000 kt by the end of 2017. It is worth noticing that the top six producers including ...
Global and China Carbon Fiber and CFRP Industry Report, 2018-2022
As a new generation of reinforced fiber boasting intrinsic properties of carbon material and excellent processability of textile fiber, carbon fiber is the one with the highest specific strength and s...
Global and China Ultra High Molecular Weight Polyethylene (UHMWPE) Industry Report, 2017-2021
Ultra High Molecular Weight Polyethylene (UHMWPE), a kind of linear polyethylene with relative molecular weight of above 1.5 million and an engineering thermoplastic with excellent comprehensive prope...
Global and China Aramid Fiber Industry Report, 2017-2021
Global aramid fiber output totaled 115kt with capacity utilization of 76.0% in 2016. As industries like environmental protection and military develop, the output is expected to rise to 138kt and capac...
Global and China Natural Rubber Industry Report, 2017-2021
In 2016, the global natural rubber output edged up 1.1% year on year to 12.4 million tons, and the consumption rose by 3.8% year on year to 12.6 million tons, indicating the gap of 200,000 tons betwee...
China Synthetic Rubber Industry Report, 2017-2021
Synthetic rubber is one of important strategic materials, mainly used in tyres and other industries. In 2016, the global output and consumption of synthetic rubber reached 14.822 million tons and 14.9...
Global and China 1,4-butanediol (BDO) Industry Report, 2017-2021
1,4-butanediol (BDO) is a key raw material for organic and fine chemicals, capable of generating various derivatives like THF, PTMEG and GBL. BDO and its derivatives find wide application in PBT plast...
Global and China Ethylene Oxide (EO) Industry Report, 2017-2021
Ethylene oxide (EO) is one of the major derivatives of the ethylene industry. Featured with special reactivity, it can generate a series of fine chemical products for a wide range of applications.
In...