China Styrene Industry Chain Report, 2014-2017
-
Aug.2014
- Hard Copy
- USD
$2,400
-
- Pages:105
- Single User License
(PDF Unprintable)
- USD
$2,250
-
- Code:
HK048
- Enterprise-wide License
(PDF Printable & Editable)
- USD
$3,400
-
- Hard Copy + Single User License
- USD
$2,600
-
Styrene is an important monomer of a polymer. Global styrene capacity totaled 33.10 million tons in 2013, mainly distributed in Northeast Asia, North America and Western Europe. China boasts the largest styrene capacity with a share of 21.4% in the world.
Styrene is used predominately in the production of expanded polystyrene (EPS), general purpose polystyrene (GPPS), high impact polystyrene (HIPS), acrylonitrile-butadiene-styrene copolymer (ABS) and styrene-butadiene rubber (SBR). China’s demand for styrene from EPS, GPPS, HIPS and ABS together accounted for about 75% of total amount in 2013.
1. EPS
China now is seeing a trend of overcapacity in EPS, whose output in 2013 was 3.68 million tons, with about 8% for export. Domestic EPS market is dominated by Taiwanese Loyal Group through its subsidiaries in Mainland China and Wuxi Xingda New Foam Plastics Materials Co., Ltd., which together held 43% of total EPS capacity in China in 2013.
2. ABS
China’s ABS market develops rapidly, with output amounting to 1.297 million tons in 2013 but 55.8% of demand depending on imports, showing vast room for future development. In 2013, there were only 11 major ABS producers in China, of which Ningbo LG Yongxing Chemical Co. Ltd. and Zhenjiang Chimei Chemical Co., Ltd. were the top two with a combined capacity share of 45%.
China’s apparent consumption of styrene in 2013 was 8.952 million tons, 59.5% of which were self-produced, presenting a certain space for import substitution. In addition, rapid development of building insulation, automobile and other sectors fueled the consumption growth of EPS, GPPS, HIPS and ABS, thus bolstering the demand for styrene.
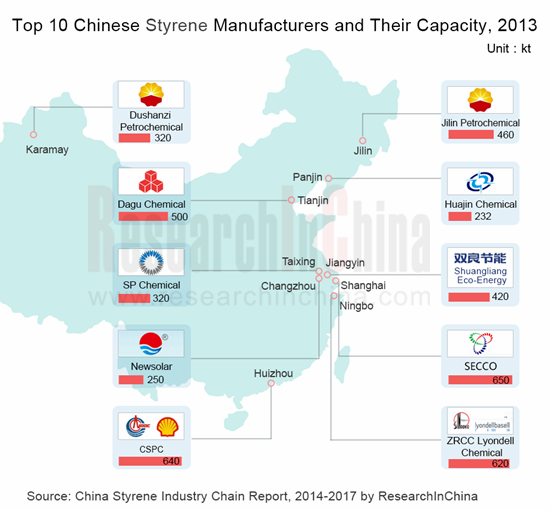
In 2013, major domestic styrene producers were subsidiaries under Sinopec and PetroChina, together occupying roughly 50% of total styrene capacity, of which Shanghai SECCO Petrochemical Company Limited, a joint venture between Sinopec and BP, has the largest styrene capacity, standing at 650 kt/a.
?
China Styrene Industry Chain Report, 2014-20017 by ResearchInChina focuses on the following:
 Global styrene capacity and distribution;
Supply and demand, import and export, competitive landscape, price and development forecast for 2014-2017 of the Chinese styrene market;
Supply and demand, import and export, competitive landscape and price of benzene and ethylene, upstream sectors of styrene in China;
Supply and demand, import and export, competitive landscape and price of EPS, GPPS, HIPS, ABS, SAN and SBR, downstream sectors of styrene in China;
Operation, styrene business, development and forecast of 11 Chinese styrene and downstream products producers.
1. Overview of Styrene
1.1 Definition
1.2 Development History
1.3 Application
1.4 Production Technology
1.5 Industry Chain
2. Styrene Market
2.1 Global Market
2.2 Chinese Market
2.2.1 Relevant Policies
2.2.2 Supply
2.2.3 Demand
2.2.4 Import and Export
2.2.5 Competitive Landscape
2.2.6 Price
3. Upstream Sectors of Styrene in China
3.1 Benzene
3.1.1 Supply
3.1.2 Demand
3.1.3 Import and Export
3.1.4 Price
3.2 Ethylene
3.2.1 Supply
3.2.2 Demand
3.2.3 Import and Export
3.2.4 Price
4. Downstream Sectors of Styrene in China
4.1 EPS
4.1.1 Supply
4.1.2 Demand
4.1.3 Import and Export
4.1.4 Competitive Landscape
4.1.5 Price
4.2 PS
4.2.1 Supply
4.2.2 Demand
4.2.3 Import and Export
4.2.4 Competitive Landscape
4.2.5 Price
4.3 ABS
4.3.1 Supply
4.3.2 Demand
4.3.3 Import and Export
4.3.4 Competitive Landscape
4.3.5 Price
4.4 SAN
4.4.1 Market Overview
4.3.2 Import and Export
4.3.3 Price
4.5 SBR
4.5.1 Supply
4.5.2 Demand
4.5.3 Import and Export
4.5.4 Competitive Landscape
4.5.5 Price
5. Major Chinese Companies
5.1 Shuangliang Eco-Energy Systems
5.1.1 Profile
5.1.2 Operation
5.1.3 Revenue Structure
5.1.4 Gross Margin
5.1.5 Styrene Business
5.1.6 Forecast and Outlook
5.2 North Huajin Chemical Industries
5.2.1 Profile
5.2.2 Operation
5.2.3 Revenue Structure
5.2.4 Gross Margin
5.2.5 Customers and Suppliers
5.2.6 Styrene Business
5.2.7 Forecast and Outlook
5.3 Shanghai SECCO Petrochemical
5.3.1 Profile
5.3.2 Operation
5.3.3 Styrene Business
5.4 CNOOC and Shell Petrochemicals
5.4.1 Profile
5.4.2 Styrene Business
5.5 Ningbo ZRCC Lyondell Chemical
5.5.1 Profile
5.5.2 Operation
5.5.3 Styrene Business
5.6 Loyal Group
5.6.1 Profile
5.6.2 EPS Business
5.7 Wuxi Xingda New Foam Plastics Materials
5.7.1 Profile
5.7.2 EPS Business
5.8 Taita Chemical
5.8.1 Profile
5.8.2 Operation
5.8.3 Revenue Structure
5.8.4 EPS Business
5.9 Zhenjiang Chimei Chemical
5.9.1 Profile
5.9.2 PS/ABS Business
5.10 BASF-YPC
5.10.1 Profile
5.10.2 PS Business
5.11 Shen Hua Chemical Industrial
5.11.1 Profile
5.11.2 Operation
5.11.3 SBR Business
6. Summary and Forecast
6.1 Summary
6.2 Supply and Demand Forecast
Applications of Styrene
Routing of Styrene
Industry Chain of Styrene
Distribution of Global Styrene Capacity by Region, 2013
Capacity, Output and Apparent Consumption of Styrene across the Globe and in China, 2013
China’s Styrene Capacity and Growth Rate, 2005-2013
China’s Styrene Output and Utilization of Capacity, 2005-2013
Major Chinese Styrene Producers and Their Capacities by the end of 2013
Styrene Projects Proposed/Under Construction, 2014
China’s Apparent Consumption of Styrene and Self-sufficiency, 2005-2013
Downstream Products and Their Major Applications of Styrene
Downstream Demand Structure of Styrene in China, 2013
Import and Export Volume of Styrene in China, 2009-2014
Average Import and Export Prices of Styrene in China, 2009-2014
Sources of Imported Styrene into China, 2013
Destinations of Exported Styrene from China, 2013
Capacity Distribution of Styrene in China (by Nature of Company), 2013
Competitive Landscape of China Styrene Industry, 2013
Capacity Distribution of Styrene in China (by Region), 2013
Capacity Distribution of Styrene in China (by Routing), 2013
Market Price Trend of Styrene (99.5%) in China, 2006-2014
Market Prices of Styrene in China (by Region), Aug. 1, 2014
Market Prices of Styrene in China (by Company), 2014
China’s Benzene Capacity and Growth Rate, 2006-2013
China’s Benzene Output and Growth Rate, 2006-2013
Output Structure of Benzene in China (by Region), 2013
China’s Apparent Consumption of Benzene and Self-sufficiency, 2008-2013
Downstream Demand Structure of Benzene in China, 2013
Import and Export Volume of Benzene in China, 2009-2014
Average Import and Export Prices of Benzene in China, 2009-2014
Sources Structure of Imported Benzene in China (by Import Volume), 2013
Market Price Trend of Benzene in China, 2006-2014
Market Prices of Benzene in China (by Region), Aug. 15, 2014
Ex-factory Prices of Benzene from Major Producers in China, 2012-2013
Capacity Structure of Ethylene in China (by Company), 2013
Ethylene Producers in China and Their Capacities, 2013
China’s Ethylene Output and Growth Rate, 2006-2013
Capacity Structure of Ethylene in China (by Region), 2013
China’s Apparent Consumption of Ethylene and Growth Rate, 2006-2013
Import and Export Volume of Ethylene in China, 2009-2014
Average Import Price of Ethylene in China, 2009-2014
Sources of Imported Ethylene into China (by Import Volume), 2013
Destinations of Exported Ethylene from China (by Export Volume), 2013
Price Trend of Ethylene in Northeast Asia, 2009-2014
Major EPS Producers in China and Their Capacities by the end of 2013
China’s EPS Output and Growth Rate, 2007-2013
China’s Apparent Consumption of EPS and Growth Rate, 2007-2013
Import and Export Volume of EPS in China, 2009-2014
Average Import and Export Prices of EPS in China, 2009-2014
Sources of Imported EPS into China, 2013
Destinations of Exported EPS from China, 2013
Competitive Landscape of China EPS Industry, 2013
Capacity Distribution of EPS in China by Region, 2013
Price Trend of Wuxi Xingda New Foam Plastics Materials’ EPS (Fuel Resistance), 2008-2014
Market Prices of EPS in China (by Company), Aug. 15, 2014
Major PS Producers in China and Their Capacities by the end of 2013
PS Projects Proposed/Under Construction in China, 2014
China’s PS Output and Growth Rate, 2009-2013
China’s Apparent Consumption of PS and Growth Rate, 2009-2013
Import and Export Volume of PS in China, 2009-2014
Average Import and Export Prices of PS in China, 2009-2014
Sources of Imported PS into China, 2013
Destinations of Exported PS from China, 2013
Competitive Landscape of China PS Industry, 2013
Capacity Distribution of PS in China by Region, 2013
Price Trend of PS (Clear/Transparent 666 D) in China, 2006-2014
Market Prices of PS in China (by Region), Aug. 15, 2014
Market Prices of PS in China (by Company), Aug. 15, 2014
Major ABS Producers in China and Their Capacities by the end of 2013
ABS Projects Proposed/Under Construction in China, 2014
China’s ABS Output and Growth Rate, 2010-2013
Output Structure of ABS in China (by Region), 2013
China’s Apparent Consumption of ABS and Growth Rate, 2010-2013
Import and Export Volume of ABS in China, 2009-2014
Average Import and Export Prices of ABS in China, 2009-2014
Sources of Imported ABS into China, 2013
Destinations of Exported ABS from China, 2013
Competitive Landscape of China ABS Industry, 2013
Capacity Distribution of ABS in China by Region, 2013
Market Price Trend of ABS (757K) in China, 2006-2014
Market Prices of ABS in China (by Region), Aug. 8, 2014
Market Prices of ABS in China (by Company), Aug. 8, 2014
Classification and Applications of SAN
Downstream Sectors and Applications of SAN
Import and Export Volume of SAN in China, 2009-2014
Average Import and Export Prices of SAN in China, 2009-2014
Sources of Imported SAN into China, 2013
Destinations of Exported SAN from China, 2013
Market Price Trend of SAN in China, 2006-2014
Market Prices of SAN in China (by Company), Aug. 8, 2014
Major SBR Producers in China and Their Capacities by the End of 2013
SBR Projects Proposed/Under Construction in China, 2014
China’s SBR Output and Growth Rate, 2005-2013
China’s Apparent Consumption of SBR and Growth Rate, 2010-2013
Import and Export Volume of SBR in China, 2010-2014
Average Import and Export Prices of SBR in China, 2010-2014
Competitive Landscape of China SBR Industry, 2013
Capacity Structure of SBR in China (by Variety), 2013
Capacity Structure of SBR in China (by Region), 2013
Market Price Trend of SBR (1500) in China, 2006-2014
Market Prices of SBR in China (by Region), Aug. 8, 2014
Market Prices of SBR in China (by Company), Aug. 8, 2014
Revenue and Net Income of Shuangliang Eco-Energy Systems, 2009-2013
Revenue Breakdown of Shuangliang Eco-Energy Systems (by Product), 2011-2013
Revenue Structure of Shuangliang Eco-Energy Systems (by Product), 2011-2013
Revenue Breakdown of Shuangliang Eco-Energy Systems (by Region), 2011-2013
Revenue Structure of Shuangliang Eco-Energy Systems (by Region), 2011-2013
Gross Margins of Main Products of Shuangliang Eco-Energy Systems, 2011-2013
Output of Styrene and EPS of Shuangliang Eco-Energy Systems, 2011-2013
Total Assets and Net Income of Leasty Chemical, 2011-2013
Revenue and Net Income of Shuangliang Eco-Energy Systems, 2013-2017E
Business Segments and Main Products of North Huajin Chemical Industries
Output of Main Products of North Huajin Chemical Industries, 2013
Revenue and Net Income of North Huajin Chemical Industries, 2009-2013
Revenue Breakdown of North Huajin Chemical Industries (by Sector), 2011-2013
Revenue Structure of North Huajin Chemical Industries (by Sector), 2011-2013
Revenue Breakdown of North Huajin Chemical Industries (by Product), 2011-2013
Revenue Structure of North Huajin Chemical Industries (by Product), 2011-2013
Revenue Breakdown of North Huajin Chemical Industries (by Region), 2011-2013
Revenue Structure of North Huajin Chemical Industries (by Region), 2011-2013
Gross Margin of North Huajin Chemical Industries (by Sector), 2011-2013
Gross Margin of North Huajin Chemical Industries (by Product), 2011-2013
North Huajin Chemical Industries’ Revenue from Top 5 Customers and % of Total Revenue, 2011-2013
Name List and Revenue Contribution of North Huajin Chemical Industries’ Top 5 Customers, 2013
Name List and Procurement of North Huajin Chemical Industries from Top 5 Suppliers, 2013
Petrochemicals Output and Sales Volume of North Huajin Chemical Industries, 2012-2013
Fine Chemicals Output and Sales Volume of North Huajin Chemical Industries, 2012-2013
Revenue and Net Income of North Huajin Chemical Industries, 2013-2017E
Revenue and Net Income of Shanghai SECCO Petrochemical, 2011-2013
Total Assets and Total Liabilities of Shanghai SECCO Petrochemical, 2011-2013
Main Production Plants and Their Capacities of Shanghai SECCO Petrochemical, 2013
Main Production Plants and Their Capacities of CNOOC and Shell Petrochemicals, 2013
Revenue and Total Pre-tax Profits of Ningbo ZRCC Lyondell Chemical, 2012-2013
Styrene and Ethylene Oxide Output of Ningbo ZRCC Lyondell Chemical, 2012-2013
EPS Subsidiaries and Their Capacities of Loyal Group, 2013
EPS Subsidiaries and Their Capacities of Wuxi Xingda New Foam Plastics Materials, 2013
EPS Capacity Under Construction of Wuxi Xingda New Foam Plastics Materials, 2014
Revenue and Net Income of Taita Chemical, 2011-2013
Revenue Breakdown of Taita Chemical (by Product), 2011-2013
Revenue Structure of Taita Chemical (by Product), 2011-2013
Revenue Breakdown of Taita Chemical (by Region), 2011-2013
Revenue Structure of Taita Chemical (by Region), 2011-2013
Development History of PS Products of Taita Chemical
Capacity of Main Products of Zhenjiang Chimei Chemical, 2013
Projects Under Construction of Zhenjiang Chimei Chemical, 2014
Main Production Plants and Their Capacities of BASF-YPC, 2013
Styrene Production Plants and Their Capacities of BASF-YPC, 2013
Turnover of Shen Hua Chemical Industrial, 2010-2012
Development History of SBR of Shen Hua Chemical Industrial
SBR Output and Sales Volume of Shen Hua Chemical Industrial, 2010-2012
Revenue Comparison among Some Companies in the Chinese Styrene Market, 2011-2013
Capacity and Output of Styrene and Its Downstream Products in China, 2013
Supply and Demand Forecast of Styrene in China, 2013-2017E
Downstream Demand Structure Forecast of Styrene in China, 2013-2017E
Global and China Synthetic Rubber Industry Report, 2021-2027
Synthetic rubber is a polymer product made of coal, petroleum and natural gas as main raw materials and polymerized with dienes and olefins as monomers, which is typically divided into general synthet...
Global and China Carbon Fiber Industry Report, 2021-2026
Carbon fiber is a kind of inorganic high performance fiber (with carbon content higher than 90%) converted from organic fiber through heat treatment. As a new material with good mechanical properties,...
Global and China Dissolving Pulp Industry Report, 2019-2025
In 2018, global dissolving pulp capacity outstripped 10 million tons and its output surged by 14.0% from a year ago to 7.07 million tons, roughly 70% of the capacity. China, as a key supplier of disso...
Global and China 1, 4-butanediol (BDO) Industry Report, 2019-2025
1,4-butanediol (BDO), an essential organic and fine chemical material, finds wide application in pharmaceuticals, chemicals, textile and household chemicals.
As of the end of 2018, the global BDO cap...
Global and China Carbon Fiber and CFRP Industry Report, 2019-2025
Among the world’s three major high performance fibers, carbon fiber features the highest strength and the highest specific modulus. It is widely used in such fields as aerospace, sports and leisure.
...
Global and China Natural Rubber Industry Report, 2019-2025
In 2018, global natural rubber industry continued remained at low ebb, as a result of economic fundamentals. Global natural rubber price presented a choppy downtrend and repeatedly hit a record low in...
Global and China Ultra High Molecular Weight Polyethylene (UHMWPE) Industry Report, 2019-2025
Ultra high molecular weight polyethylene (UHMWPE), a kind of linear polyethylene with relative molecular weight of above 1.5 million used as an engineering thermoplastic with excellent comprehensive p...
China Polyether Monomer Industry Report, 2019-2025
China has seen real estate boom and issued a raft of policies for continuous efforts in improving weak links in infrastructure sector over the years. Financial funds of RMB1,663.2 billion should be al...
Global and China Viscose Fiber Industry Report, 2019-2025
Over the recent years, the developed countries like the United States, Japan and EU members have withdrawn from the viscose fiber industry due to environmental factor and so forth, while the viscose f...
Global and China Synthetic Rubber (BR, SBR, EPR, IIR, NBR, Butadiene, Styrene, Rubber Additive) Industry Report, 2018-2023
In 2018, China boasted a total synthetic rubber capacity of roughly 6,667kt/a, including 130kt/a new effective capacity. Considering capacity adjustment, China’s capacity of seven synthetic rubbers (B...
Global and China Dissolving Pulp Industry Report, 2018-2022
With the commissioning of new dissolving pulp projects, the global dissolving pulp capacity had been up to about 8,000 kt by the end of 2017. It is worth noticing that the top six producers including ...
Global and China Carbon Fiber and CFRP Industry Report, 2018-2022
As a new generation of reinforced fiber boasting intrinsic properties of carbon material and excellent processability of textile fiber, carbon fiber is the one with the highest specific strength and s...
Global and China Ultra High Molecular Weight Polyethylene (UHMWPE) Industry Report, 2017-2021
Ultra High Molecular Weight Polyethylene (UHMWPE), a kind of linear polyethylene with relative molecular weight of above 1.5 million and an engineering thermoplastic with excellent comprehensive prope...
Global and China Aramid Fiber Industry Report, 2017-2021
Global aramid fiber output totaled 115kt with capacity utilization of 76.0% in 2016. As industries like environmental protection and military develop, the output is expected to rise to 138kt and capac...
Global and China Natural Rubber Industry Report, 2017-2021
In 2016, the global natural rubber output edged up 1.1% year on year to 12.4 million tons, and the consumption rose by 3.8% year on year to 12.6 million tons, indicating the gap of 200,000 tons betwee...
China Synthetic Rubber Industry Report, 2017-2021
Synthetic rubber is one of important strategic materials, mainly used in tyres and other industries. In 2016, the global output and consumption of synthetic rubber reached 14.822 million tons and 14.9...
Global and China 1,4-butanediol (BDO) Industry Report, 2017-2021
1,4-butanediol (BDO) is a key raw material for organic and fine chemicals, capable of generating various derivatives like THF, PTMEG and GBL. BDO and its derivatives find wide application in PBT plast...
Global and China Ethylene Oxide (EO) Industry Report, 2017-2021
Ethylene oxide (EO) is one of the major derivatives of the ethylene industry. Featured with special reactivity, it can generate a series of fine chemical products for a wide range of applications.
In...