Global and China Polyurethane Industry Chain Report, 2014-2017
-
Jan.2015
- Hard Copy
- USD
$2,500
-
- Pages:108
- Single User License
(PDF Unprintable)
- USD
$2,300
-
- Code:
HK053
- Enterprise-wide License
(PDF Printable & Editable)
- USD
$3,600
-
- Hard Copy + Single User License
- USD
$2,700
-
Polyurethane products, consisting mainly of polyurethane rigid foam, flexible foam, elastomer, coatings, adhesives and fiber, find widespread application in fields like construction, automobile, refrigeration, footwear, synthetic leather and fabric.
Global demand for polyurethane products approximated 20.30 million tons in 2014, with new demand largely coming from emerging markets including Asia Pacific and South America. Rigid foam and flexible foam hold the lion’s share of demand for polyurethane products in the world, accounting for about 60% of total amount.
China is the world’s largest producer and consumer of polyurethane products. China’s demand for polyurethane products took up about 45% of global total demand, and is expected to maintain a growth rate of 10% or so over the next couple years, with the share in global demand for polyurethane products rising to 55% by 2017.
Polyurethane rigid foam and flexible foam are the two kinds of products that see fairly rapid growth in demand in China, together accounting for 46% in 2014. Rigid foam is mainly used in refrigeration, building energy conservation, solar thermal insulation, etc.; flexible foam is chiefly applied to automobile, furniture, etc. It is expected the demand for these two products will grow by about 15% and 12% over the next three years, respectively.
The upstream materials of polyurethane include three categories, namely, isocyanates (mainly MDI and TDI), polyatomic alcohols (chiefly PPG, PTMEG, BDO and AA) and auxiliaries (principally DMF).
1. MDI
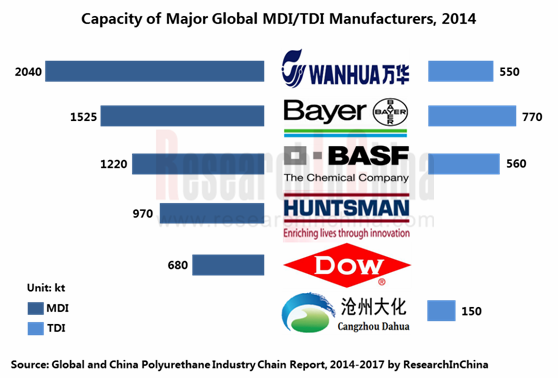
Global MDI capacity was about 7,095 kt in 2014, with new capacity mainly being 600 kt of Wanhua Chemical and 150 kt of Bayer Shanghai. Global MDI industry is highly concentrated, with Wanhua Chemical, Bayer and BASF being the top three companies in terms of capacity, together accounting for 67.5% of total global capacity.
Global new MDI capacity will stand at around 1,760 kt during 2015-2018, mostly in China. Main projects include 500kt built by Bayer in Shanghai and 400kt of BASF in Chongqing.
2. TDI
In 2014, global new TDI capacities mainly cover 300kt of Wanhua Chemical and 300kt of Bayer in Germany. Newly-built 300kt plants of BASF in Germany will go into production in the second quarter of 2015.
As of the end of 2014, global top 3 three companies in terms of TDI capacity were Bayer, BASF and Wanhua Chemical, occupying a combined 64.8% share of total global TDI capacity,
?
3. PPG
In 2014, global polyether polyol capacity totaled about 9,500 kt, leading to obvious overcapacity and with a capacity utilization rate of just around 70%. Global polyether polyol industry is highly concentrated, dominated by several multinational companies such as Bayer, BASF, Dow Chemical and Shell.
In 2014, there were over 40 polyether polyol producers in China, of which only more than 10 ones boasted 100kt and above plants, including mainly Sinopec Shanghai Gaoqiao Company, CNOOC and Shell Petrochemicals, Shandong Bluestar Dongda Chemical, Nanjing Hongbaoli, etc.
Global and China Polyurethane Industry Chain Report, 2014-2017 by ResearchInChina focuses on the following:
 Supply & demand and forecast in global polyurethane industry;
Industrial policies, supply & demand, import & export, development trend and forecast in China polyurethane industry;
Global and China polyurethane rigid foam, flexible foam, elastomer, coatings demand;
Supply & demand, competitive landscape, import & export, price and forecast in global and China MDI, TDI, PPG industries;
Demand for polyurethane from building energy efficiency, refrigeration, water heater and automobile industries in China and forecast;
Operation, polyurethane business and development of 10 global and Chinese polyurethane and raw materials producers.
1. Overview of Polyurethane Industry
1.1 Overview of Polyurethane
1.2 Raw Materials for Polyurethane
1.3 Polyurethane Products
1.4 Industry Chain
2. Overall Polyurethane Market
2.1 Global
2.2 China
2.2.1 Development Status Quo
2.2.2 Policy
2.2.3 Supply and Demand
2.2.4 Import and Export
2.2.5 Development Trend
3. Polyurethane Market Segments
3.1 Polyurethane Rigid Foam
3.1.1 Overview
3.1.2 Global
3.1.3 China
3.2 Polyurethane Flexible Foam
3.3 CASE System
3.3.1 Synthetic Leather Slurry
3.3.2 Coatings
3.3.3 Polyurethane Elastomer
3.3.4 Polyurethane Fiber
3.3.5 Others
4. Upstream Raw Materials of Polyurethane
4.1 MDI
4.1.1 Global
4.1.2 China
4.1.3 Import and Export
4.1.4 Price
4.2 TDI
4.2.1 Global
4.2.2 China
4.2.3 Import and Export
4.2.4 Price
4.3 PPG
4.3.1 Global
4.3.2 China
4.3.3 Price
4.4 Others
4.4.1 AA
4.4.2 BDO
4.4.3 PTMEG
4.4.4 DMF
4.4.5 PO
5. Downstream Demand for Polyurethane
5.1 Building Energy Efficiency
5.2 Refrigeration
5.3 Water Heater
5.4 Automobile
6. Major Global Companies
6.1 BASF
6.1.1 Profile
6.1.2 Operation
6.1.3 Operation of Functional Materials & Solutions
6.1.4 Polyurethane Business
6.1.5 Business in China
6.2 Bayer
6.2.1 Profile
6.2.2 Operation
6.2.3 Operation of Bayer MaterialScience
6.2.4 Polyurethane Business
6.2.5 Development in China
6.3 Huntsman
6.3.1 Profile
6.3.2 Operation
6.3.3 Revenue Structure
6.3.4 Polyurethane Business
6.3.5 Development in China
6.4 Dow Chemical
6.4.1 Profile
6.4.2 Operation
6.4.3 Operation of Performance Material Division
6.4.4 Polyurethane Business
6.4.5 Development in China
6.5 Nippon Polyurethane Industry
7. Major Chinese Companies
7.1 Wanhua Chemical
7.1.1 Profile
7.1.2 Operation
7.1.3 Revenue Structure
7.1.4 Gross Margin
7.1.5 R&D
7.1.6 Polyurethane Business
7.1.7 Prediction and Outlook
7.2 Cangzhou Dahua
7.2.1 Profile
7.2.2 Operation
7.2.3 Revenue Structure
7.2.4 Gross Margin
7.2.5 R&D
7.2.6 TDI Business
7.2.7 Prediction and Outlook
7.3 Yantai Juli Fine Chemical
7.3.1 Profile
7.3.2 TDI Business
7.4 Hongbaoli
7.4.1 Profile
7.4.2 Operation
7.4.3 Revenue Structure
7.4.4 Gross Margin
7.4.5 R&D
7.4.6 Polyurethane Business
7.4.7 Prediction and Outlook
7.5 Lecron Energy Saving Materials
7.5.1 Profile
7.5.2 Operation
7.5.3 Revenue Structure
7.5.4 Gross Margin
7.5.5 R&D
7.5.6 Customer and Supplier
7.5.7 Rigid-foam Formulated Polyol Business
7.5.8 Prediction and Outlook
8. Summary and Forecast
8.1 Summary
8.2 Forecast
Performance Comparison of Polyurethane Materials and Traditional Materials
Classification of Polyurethane Materials
Polyurethane Products and Their Raw Materials and Application Fields
Polyurethane Industry Chain
Global Polyurethane Products Demand, 2010-2014
Global Polyurethane Products Structure by Demand, 2014
Regional Distribution of Global Polyurethane Products by Demand, 2014
Policies Concerning Polyurethane Industry in China, 2011-2015
China’s Polyurethane Products Demand and YoY Growth, 2006-2014
Structure of Polyurethane Products in China by Demand, 2014
Import and Export Volume of Polyurethane Resin in China, 2010-2014
Average Import and Export Prices of Polyurethane Resin in China, 2010-2014
Sources of Imported Polyurethane Resin in China by Import Volume, Jan.-Oct. 2014
Destinations of Exported Polyurethane Resin from China by Export Volume, Jan.-Oct. 2014
Regional Distribution of Polyurethane Industry in China
Raw Materials for Polyurethane Rigid Foam and Functions
Global Polyurethane Rigid Foam Demand and Growth Rate, 2006-2014
Polyurethane Rigid Foam Consumption Structure in the United States, 2014
China’s Polyurethane Rigid Foam Demand and Growth Rate, 2006-2014
Polyurethane Rigid Foam Consumption Structure in China, 2014
China’s Polyurethane Flexible Foam Demand and Growth Rate, 2006-2014
Major Global MDI Producers and Their Capacities (Excluding Refining Plants), 2014
Main MDI Projects Proposed/Under Construction Globally, 2015E-2018E
Regional Distribution of Global MDI Capacity, 2014
Percentage of Major Global MDI Producers’ Capacity, 2014
Capacity of Chinese MDI Producers, 2010-2014
Import and Export Volume of Pure MDI in China, 2010-2014
Average Import and Export Prices of Pure MDI in China, 2010-2014
Sources of Imported Pure MDI into China by Import Volume, Jan.-Oct. 2014
Destinations of Exported Pure MDI from China by Export Volume, Jan.-Oct. 2014
Import and Export Volume of Polymeric MDI in China, 2010-2014
Average Import and Export Prices of Polymeric MDI in China, 2010-2014
Distribution of Sources of Imported Polymeric MDI in China by Import Volume, Jan.-Oct. 2014
Distribution of Destinations of Exported Polymeric MDI from China by Export Volume, Jan.-Oct. 2014
Average Monthly Price of MDI in China, 2009-2014
Major Global TDI Producers and Their Capacities, 2014
Some TDI Projects Proposed/Under Construction, 2014
Regional Distribution of Global TDI Capacity, 2014
Percentage of Major Global TDI Producers’ Capacity, 2014
Capacity of Chinese TDI Producers, 2010-2014
Main TDI Projects Proposed/Under Construction in China, 2015
Import and Export Volume of TDI in China, 2010-2014
Average Import and Export Prices of TDI in China, 2010-2014
Sources of Imported TDI into China by Import Volume, Jan.-Oct. 2014
Destinations of Exported TDI from China by Export Volume, Jan.-Oct. 2014
Average Monthly Price of TDI in China, 2006-2014
Regional Distribution of Global Polyether Capacity, 2014
Major Chinese Polyether Polyol Producers and Their Capacities, 2014
China’s Polyether Polyol Output and Growth Rate, 2007-2014
Average Monthly Price of Polyether (5613) in China, 2006-2014
Performance Comparison of Main Building Thermal Insulation Materials
Demand for Polyurethane Rigid Foam from Building Energy Efficiency Industry, 2010-2017E
China’s Refrigerator and Freezer Output, 2010-2017E
Demand for Polyurethane Rigid Foam from Refrigerator and Freezer in China, 2010-2017E
Demand for Polyurethane Rigid Foam from Solar Water Heater Industry, 2011-2015E
China’s Automobile Output and Growth Rate, 2010-2017E
Business Segments and Primary Businesses of BASF
Revenue and Net Income of BASF, 2010-2014
Revenue Structure of BASF by Business Segment in the First Three Quarters of 2014
Revenue and EBITDA of Functional Materials & Solutions of BASF, 2012-2014
Revenue Breakdown of Functional Materials & Solutions of BASF by Product, 2012-2014
Revenue Structure of Functional Materials & Solutions of BASF by Product, 2012-2014
Percentage of Revenue from Performance Materials Business of BASF by Region, 2013
Polyurethane Products of BASF
Distribution of BASF’s MDI Capacity and Projects Proposed/Under Construction, 2014
Distribution of BASF’s TDI Capacity and Projects Proposed/Under Construction, 2014
Revenue and Net Income of Bayer, 2010-2014
Revenue Structure of Bayer by Subgroup, 2012-2014
Revenue and EBITDA of Bayer MaterialScience, 2010-2014
Revenue Breakdown of Bayer MaterialScience by Product, 2012-2014
Revenue Structure of Bayer MaterialScience by Product, 2012-2014
Revenue Breakdown of Bayer MaterialScience by Region, 2012-2014
Revenue Structure of Bayer MaterialScience by Region, 2012-2014
Distribution of Bayer’s MDI Capacity and Projects Proposed/Under Construction, 2014
Distribution of Bayer’s TDI Capacity and Projects Proposed/Under Construction, 2014
Business Segments and Main Products of Huntsman
Revenue and Net Income of Huntsman, 2010-2014
Revenue Breakdown of Huntsman by Business Segment, 2012-2014
Revenue Structure of Huntsman by Business Segment, 2012-2014
Revenue Breakdown of Huntsman by Region, 2011-2013
Revenue Structure of Huntsman by Region, 2011-2013
Huntsman’s Revenue and EBITDA from Polyurethane Segment, 2010-2014
Distribution of Huntsman’s MDI Capacity and Projects Proposed/Under Construction, 2013
Net Sales and Net Income of Dow Chemical, 2009-2013
Revenue Structure of Dow Chemical by Segment, 2013
Dow Chemical’s Revenue and EBITDA from Performance Material Segment, 2009-2013
Revenue Structure of Dow Chemical’s Performance Material Segment by Product, 2013
Distribution of Dow Chemical’s Capacity, 2014
Revenue and Net Income of Wanhua Chemical, 2010-2014
Revenue Breakdown of Wanhua Chemical by Product, 2012-2014
Revenue Structure of Wanhua Chemical by Product, 2012-2014
Revenue Breakdown of Wanhua Chemical by Region, 2012-2014
Revenue Structure of Wanhua Chemical by Region, 2012-2014
Gross Margin of Wanhua Chemical’s Main Products, 2011-2014
R&D Costs and % of Total Revenue of Wanhua Chemical, 2011-2014
Main Products of Wanhua Chemical
MDI Capacity Expansion of Wanhua Chemical, 2011-2014
Revenue and Net Income of Wanhua Rongwei Polyurethane, 2010-2014
Revenue and Net Income of Wanhua Chemical, 2013-2017E
Revenue and Net Income of Cangzhou Dahua, 2010-2014
Revenue Breakdown of Cangzhou Dahua by Product, 2012-2014
Revenue Structure of Cangzhou Dahua by Product, 2012-2014
Gross Margin of Cangzhou Dahua’s Main Products, 2011-2014
R&D Costs and % of Total Revenue of Cangzhou Dahua, 2011-2013
TDI Capacity, Output and Utilization of Cangzhou Dahua, 2010-2014
TDI Output of Cangzhou Dahua by Company, 2010-2014
Revenue and Net Income of Cangzhou Dahua, 2013-2017E
Revenue and Net Income of Hongbaoli, 2010-2014
Revenue Breakdown of Hongbaoli by Product, 2012-2014
Revenue Structure of Hongbaoli by Product, 2012-2014
Revenue Breakdown of Hongbaoli by Region, 2012-2014
Revenue Structure of Hongbaoli by Region, 2012-2014
Gross Margin of Hongbaoli’s Main Products, 2011-2014
R&D Costs and % of Total Revenue of Hongbaoli, 2011-2013
Rigid-foam Formulated Polyether Capacity of Hongbaoli, 2009-2014
Revenue and Net Income of Hongbaoli, 2013-2017E
Revenue and Net Income of Lecron Energy Saving Materials, 2010-2014
Revenue Breakdown of Lecron Energy Saving Materials by Product, 2012-2014
Revenue Structure of Lecron Energy Saving Materials by Product, 2012-2014
Revenue Breakdown of Lecron Energy Saving Materials by Region, 2012-2014
Revenue Structure of Lecron Energy Saving Materials by Region, 2012-2014
Gross Margin of Lecron Energy Saving Materials’ Main Products, 2011-2014
R&D Costs and % of Total Revenue of Lecron Energy Saving Materials, 2011-2013
Lecron Energy Saving Materials’ Revenue from Top 5 Customers and % of Total Revenue, 2012-2014
Name List and Revenue Contribution of Lecron Energy Saving Materials’ Top 5 Customers, 2013
Lecron Energy Saving Materials’ Procurement from Top 5 Suppliers and % of Total Procurement, 2012-2014
Name List and Procurement of Lecron Energy Saving Materials’ Top 5 Suppliers, 2014H1
Rigid-foam Formulated Polyether Output and Sales Volume of Lecron Energy Saving Materials, 2009-2013
Polyurethane Sheet Output and Sales Volume of Lecron Energy Saving Materials, 2012-2013
Revenue and Net Income of Lecron Energy Saving Materials, 2013-2017E
Operation of Major Global and Chinese Companies’ Polyurethane Business, 2013
Global and China Polyurethane Products Consumption, 2013-2017E
Global and China MDI Capacity, 2013-2017E
Global and China TDI Capacity, 2013-2017E
Global and China Synthetic Rubber Industry Report, 2021-2027
Synthetic rubber is a polymer product made of coal, petroleum and natural gas as main raw materials and polymerized with dienes and olefins as monomers, which is typically divided into general synthet...
Global and China Carbon Fiber Industry Report, 2021-2026
Carbon fiber is a kind of inorganic high performance fiber (with carbon content higher than 90%) converted from organic fiber through heat treatment. As a new material with good mechanical properties,...
Global and China Dissolving Pulp Industry Report, 2019-2025
In 2018, global dissolving pulp capacity outstripped 10 million tons and its output surged by 14.0% from a year ago to 7.07 million tons, roughly 70% of the capacity. China, as a key supplier of disso...
Global and China 1, 4-butanediol (BDO) Industry Report, 2019-2025
1,4-butanediol (BDO), an essential organic and fine chemical material, finds wide application in pharmaceuticals, chemicals, textile and household chemicals.
As of the end of 2018, the global BDO cap...
Global and China Carbon Fiber and CFRP Industry Report, 2019-2025
Among the world’s three major high performance fibers, carbon fiber features the highest strength and the highest specific modulus. It is widely used in such fields as aerospace, sports and leisure.
...
Global and China Natural Rubber Industry Report, 2019-2025
In 2018, global natural rubber industry continued remained at low ebb, as a result of economic fundamentals. Global natural rubber price presented a choppy downtrend and repeatedly hit a record low in...
Global and China Ultra High Molecular Weight Polyethylene (UHMWPE) Industry Report, 2019-2025
Ultra high molecular weight polyethylene (UHMWPE), a kind of linear polyethylene with relative molecular weight of above 1.5 million used as an engineering thermoplastic with excellent comprehensive p...
China Polyether Monomer Industry Report, 2019-2025
China has seen real estate boom and issued a raft of policies for continuous efforts in improving weak links in infrastructure sector over the years. Financial funds of RMB1,663.2 billion should be al...
Global and China Viscose Fiber Industry Report, 2019-2025
Over the recent years, the developed countries like the United States, Japan and EU members have withdrawn from the viscose fiber industry due to environmental factor and so forth, while the viscose f...
Global and China Synthetic Rubber (BR, SBR, EPR, IIR, NBR, Butadiene, Styrene, Rubber Additive) Industry Report, 2018-2023
In 2018, China boasted a total synthetic rubber capacity of roughly 6,667kt/a, including 130kt/a new effective capacity. Considering capacity adjustment, China’s capacity of seven synthetic rubbers (B...
Global and China Dissolving Pulp Industry Report, 2018-2022
With the commissioning of new dissolving pulp projects, the global dissolving pulp capacity had been up to about 8,000 kt by the end of 2017. It is worth noticing that the top six producers including ...
Global and China Carbon Fiber and CFRP Industry Report, 2018-2022
As a new generation of reinforced fiber boasting intrinsic properties of carbon material and excellent processability of textile fiber, carbon fiber is the one with the highest specific strength and s...
Global and China Ultra High Molecular Weight Polyethylene (UHMWPE) Industry Report, 2017-2021
Ultra High Molecular Weight Polyethylene (UHMWPE), a kind of linear polyethylene with relative molecular weight of above 1.5 million and an engineering thermoplastic with excellent comprehensive prope...
Global and China Aramid Fiber Industry Report, 2017-2021
Global aramid fiber output totaled 115kt with capacity utilization of 76.0% in 2016. As industries like environmental protection and military develop, the output is expected to rise to 138kt and capac...
Global and China Natural Rubber Industry Report, 2017-2021
In 2016, the global natural rubber output edged up 1.1% year on year to 12.4 million tons, and the consumption rose by 3.8% year on year to 12.6 million tons, indicating the gap of 200,000 tons betwee...
China Synthetic Rubber Industry Report, 2017-2021
Synthetic rubber is one of important strategic materials, mainly used in tyres and other industries. In 2016, the global output and consumption of synthetic rubber reached 14.822 million tons and 14.9...
Global and China 1,4-butanediol (BDO) Industry Report, 2017-2021
1,4-butanediol (BDO) is a key raw material for organic and fine chemicals, capable of generating various derivatives like THF, PTMEG and GBL. BDO and its derivatives find wide application in PBT plast...
Global and China Ethylene Oxide (EO) Industry Report, 2017-2021
Ethylene oxide (EO) is one of the major derivatives of the ethylene industry. Featured with special reactivity, it can generate a series of fine chemical products for a wide range of applications.
In...