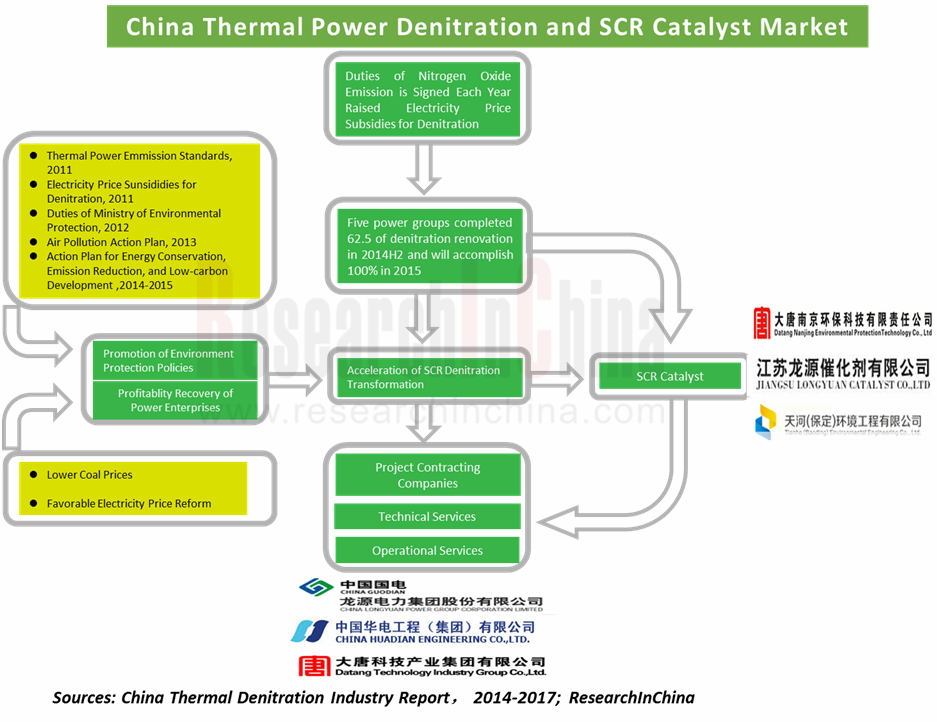
China Thermal Power Denitration Industry Report, 2014-2017
-
Jan.2015
- Hard Copy
- USD
$2,400
-
- Pages:98
- Single User License
(PDF Unprintable)
- USD
$2,250
-
- Code:
ZL020
- Enterprise-wide License
(PDF Printable & Editable)
- USD
$3,400
-
- Hard Copy + Single User License
- USD
$2,600
-
With rapid economic development and enhanced industrialization in China, the air pollution is worsening, while environmental control measures become increasingly stringent. China has already turned to be the world's largest NOx emitter, and flue gas denitrification has become an important task following desulfurization. In 2013, the NOx emission went down 4.7% year on year to 22.274 million tons, thanks to denitration policies implemented by thermal power plants.
As of June 2014, China's installed generating capacity totaled 1.3 billion kilowatts, of which thermal power installed capacity reached 880 million kilowatts with a share of 67.7% which was lower than before. Thermal power consumes about 1.7 billion tons of coal each year, and discharged 8.8 million tons of NOx (accounting for 39.5% of the total NOx emission) in 2013. In view of this, the government has introduced compulsory measures to require all the existing thermal power plants and the ones under construction to install denitration equipment. Therefore, China’s denitration construction will reach a peak during 2012-2015. In H1 2014, the new thermal power denitration units had 120 million kilowatts, and the installed denitration capacity amounted to 550 million kilowatts, equivalent to 62.5% of the total installed capacity of thermal power, showing huge potentials.
As for the denitration project construction, GuodianLongyuan ranked first in the cumulative installed capacity which was put into operation in 2013, enjoying the largest share 21% and followed by China Huadian Engineering with 8% and Datang Technology with 7%. These enterprises are environmental protection companies subject to power generation groups. Given SCR denitration catalysts occupy 40% of the total denitration renovation costs and the future demand is great, a large number of enterprises are actively creating or expanding capacity herein.
In 2014, China’s SCR denitration catalyst capacity exceeded 400,000 m3, of which 50,000 m3 / a and 40,000 m3 / a came from China’s largest SCR denitration catalyst suppliers -- Tianhe Environmental Engineering and Datang Nanjing Environmental Protection respectively. Jiangsu Longyuan, Jiangsu Wonder and other companies had the respective capacity of about 20,000 m3 / a.
The report includes the following aspects:
 Status quo, competition pattern, supply & demand and development trends of China thermal power denitration industry,;
Technical characteristics, competition pattern and development trends of China SCR denitration catalyst;
Status quo, denitration business and prospects of 20 major Chinese thermal power denitration enterprises (CPI Yuanda, Wuxi Huaguang Boiler, Beijing SPC Environment Protection Tech, DKC, etc.).
1 Overview of Thermal Power Denitration
1.1 Background of Denitration
1.2 Denitration Catalyst
1.2.1 SCR Denitration Catalyst
1.2.2 Denitration Principle
1.2.3 SCR Denitration Process
1.2.4 Industry Chain
1.2.5 Barriers to Entry
2 Status Quo of Thermal Power Denitration in China
2.1 Development Environment
2.1.1 Policy
2.1.2 Industry
2.1.3 Technology
2.2 Thermal Power Denitration
2.2.1 NOx Emission
2.2.2 Thermal Power Denitration Technology
2.2.3 Thermal Power Denitration Installed Capacity
2.3 Denitration Catalyst Demand
2.4 Denitration Catalyst Supply
3 Competition in Chinese Denitration Market
3.1 Denitration
3.2 SCR Catalyst
4 Key Enterprises in ChinaDenitration Industry
4.1 CPI Yuanda
4.1.1 Profile
4.1.2 Operation
4.1.3 Revenue Structure
4.1.4 Gross Margin
4.1.5 Denitration Business
4.1.6 Prospect and Forecast
4.2 WuxiHuaguang Boiler
4.2.1 Profile
4.2.2 Operation
4.2.3 Revenue Structure
4.2.4 Gross Margin
4.2.5 Denitration Business
4.2.6 Prospect and Forecast
4.3 FujianLongking
4.3.1 Profile
4.3.2 Operation
4.3.3 Revenue Structure
4.3.4 Gross Margin
4.3.5 Denitration Business
4.3.6 Prospect and Forecast
4.4 ZhejiangFeida Environmental Science & Technology
4.4.1 Profile
4.4.2 Operation
4.4.3 Revenue Structure
4.4.4 Gross Margin
4.4.5 Denitration Business
4.4.6 Prospect and Forecast
4.5 Yonker Environmental Protection
4.5.1 Profile
4.5.2 Operation
4.5.3 Revenue Structure
4.5.4 Gross Margin
4.5.5 Denitration Business
4.5.6 Prospect and Forecast
4.6 Beijing SPC Environment Protection Tech
4.6.1 Profile
4.6.2 Operation
4.6.3 Revenue Structure
4.6.4 Gross Margin
4.6.5 Denitration Business
4.6.6 Prospect and Forecast
4.7 Yantai Longyuan Power Technology
4.7.1 Profile
4.7.2 Revenue
4.7.3 Revenue Structure
4.7.4 Gross Margin
4.7.5 Denitration Business
4.7.6 Prospect and Forecast
4.8 Insigma Technology
4.8.1 Profile
4.8.2 Revenue
4.8.3 Revenue Structure
4.8.4 Gross Margin
4.8.5 Denitration Business
4.8.6 Prospect and Forecast
4.9 ChinaHuadian Engineering
4.9.1 Profile
4.9.2 Operation
4.9.3 Denitration Business
4.10 Guodian Technology & Environment Group
4.10.1 Profile
4.10.2 Operation
4.10.3 Revenue Structure
4.10.4 Denitration Business
4.11 Xi’anQiyuan Mechanical and Electrical Equipment
4.11.1 Profile
4.11.2 Operation
4.11.3Denitration Business
4.12 DKC (Chengdu Dongfang KWH Environmental Protection Catalysts Co., Ltd.)
4.12.1 Profile
4.12.2 Operation
4.12.3 Major Customers
4.13 Datang Nanjing Environmental Protection
4.13.1 Profile
4.13.2 Operation
4.13.2 Denitration Business
4.14 Jiangsu Wonder
4.14.1 Profile
4.14.2 Denitration Business
4.15 TUNA
4.15.1 Profile
4.15.2 Operation
4.15.3 Denitration Business
4.16 Tianhe Environmental Engineering
4.16.1 Profile
4.16.2 Operation
4.16.3 Denitration Business
4.17 Other Enterprises
4.17.1 ZhejiangHailiang
4.17.2 ZhuozhouZhongtian
4.17.3 BeijingDenox
4.17.4 Shandong GEMSKY
5 Summary and Forecast
5.1 Summary
5.2 Forecast
Cellular, Plate and Corrugated Catalysts (from left to right)
SCR Denitration Principles
SCR Denitration Process of Typical Thermal Power Plants
SCR Denitration Catalyst Industry Chain
Policies on ChinaDenitration Industry, 2009-2014
Air Pollution Emission Standards for Coal-fired Boilers of Thermal Power Plants, 2011
China's Investment in Environmental Control, 2005-2013
China's Investment in Pollution Control of Old Industrial Sources, 2005-2013
China's Pollution Facility Operating Costs, 2005-2013
Main Technical Sources of Major SCR Denitration Catalyst Manufacturers in China
China’s NOx Emission, 2007-2016E
China’s NOx Emission Sources, 2013
China’s NOx Emission (by Industry), 2013
China’s Thermal Power NOx Emission, 2007-2014
Power Plants Using SCNR Technology in China
Comparison between Low Nitrogen Combustion Technology and Flue Gas Denitrification Technology
China’s Thermal Power Denitration Installed Capacity and Proportion, 2005-2014
China's SCR Denitration Catalyst Demand, 2010-2017E
China's SCR Denitration Catalyst Demand (by Type), 2010-2017E
China's SCR Denitration Catalyst Capacity, 2011-2014
Cumulative Market Share of Major Companies by Total Installed Capacity of Denitration Units, 2013
Major Denitration Enterprises
Geographical Distribution of SCR Catalyst Manufacturers in China, 2013
Capacity of Major SCR Catalyst Manufacturers in China
SCR Denitration Catalyst Price
Revenue and Net Income of CPI Yuanda, 2008-2014
Revenue Breakdown of CPI Yuanda (by Product), 2008-2014
Revenue Structure of CPI Yuanda (by Region), 2013-2014
Gross Margin of CPI Yuanda (by Product), 2008-2014
Denitration Catalyst Sales Volume of CPI Yuanda, 2010-2014
Subsidiaries of CPI Yuanda and Their Business
Revenue and Net Income of CPI Yuanda, 2012-2017E
Revenue and Net Income of WuxiHuaguang Boiler, 2008-2014
Revenue Breakdown of WuxiHuaguang Boiler (by Product), 2008-2014
Revenue Breakdown of WuxiHuaguang Boiler (by Region), 2009-2014
Gross Margin of WuxiHuaguang Boiler (by Product), 2008-2014
Denitration Catalyst Capacity of WuxiHuaguang Boiler, 2012-2014
Revenue and Net Income of WuxiHuaguang Boiler, 2012-2017E
Revenue and Net Income of FujianLongking, 2008-2014
Revenue Breakdown of FujianLongking (by Product), 2008-2014
Revenue Breakdown of FujianLongking (by Region), 2008-2014
Gross Margin of FujianLongking (by Product), 2008-2014
Revenue and Net Income of FujianLongking, 2012-2017E
Revenue and Net Income of ZhejiangFeida Environmental Science & Technology, 2008-2014
Revenue Breakdown of ZhejiangFeida Environmental Science & Technology (by Product), 2008-2014
Revenue Breakdown of ZhejiangFeida Environmental Science & Technology (by Region), 2008-2014
Gross Margin of ZhejiangFeida Environmental Science & Technology, 2008-2014
Output and Sales Volume of Environmental Protection Equipment of ZhejiangFeida Environmental Science & Technology, 2011-2013
Revenue and Net Income of ZhejiangFeida Environmental Science & Technology, 2012-2017E
Revenue and Net Income of Yonker Environmental Protection, 2008-2014
Revenue Breakdown of Yonker Environmental Protection (by Product), 2008-2014
Revenue Breakdown of Yonker Environmental Protection (by Region), 2008-2014
Gross Margin of Yonker Environmental Protection (by Product), 2008-2014
Revenue and Net Income of Beijing SPC Environment Protection Tech, 2008-2014
Revenue Breakdown of Beijing SPC Environment Protection Tech (by Product), 2008-2014
Revenue Breakdown of Beijing SPC Environment Protection Tech (by Region), 2013-2014
Gross Margin of Beijing SPC Environment Protection Tech (by Product), 2008-2014
Revenue and Net Income of Beijing SPC Environment Protection Tech, 2012-2017E
Revenue and Net Income of Yantai Longyuan Power Technology, 2008-2014
Revenue Breakdown of Yantai Longyuan Power Technology (by Product), 2008-2014
Revenue Structure of Yantai Longyuan Power Technology (by Region), 2013-2014
Gross Margin of Yantai Longyuan Power Technology (by Product), 2008-2014
Revenue and Net Income of Yantai Longyuan Power Technology, 2012-2017E
Revenue and Net Income of Insigma Technology, 2008-2014
Revenue Breakdown of Insigma Technology (by Product), 2008-2014
Revenue Breakdown of Insigma Technology (by Region), 2008-2014
Gross Margin of Insigma Technology (by Product), 2008-2014
Revenue and Net Income of United Mechanical & Electrical, 2012-2014
Revenue and Net Income of Insigma Technology, 2012-2017E
Revenue and Net Income of ChinaHuadian Engineering, 2008-2014
Environmental Protection Subsidiaries and Major Business of Guodian Tech
Revenue and Net Income of Guodian Tech, 2008-2014
Revenue Breakdown of Guodian Tech (by Product), 2008-2014
Environmental Protection Revenue of Guodian Tech, H1 2014
Denitration Catalyst Capacity of Guodian Tech, 2010-2015E
Revenue and Net Income of Xi'anQiyuan Mechanical and Electrical Equipment, 2008-2014
DKC's Revenue and Net Income, 2010-2013
DKC's Major Customers in China, 2012-2014
Denitration Catalyst Capacity of Datang Nanjing Environmental Protection, 2011-2014
Major Denitration Projects of Datang Nanjing Environmental Protection, 2012-2014
Denitration Catalyst Capacity Plan of Jiangsu Wonder
TUNA's Revenue Breakdown (by Product), 2011-2014
Revenue of Tianhe Environmental Engineering, 2011-2013
SCR Catalyst Capacity of Tianhe Environmental Engineering, 2011-2014
Performance of ZhejiangHailiang, 2013-2014
Environmental Protection SCR Catalyst Capacity of ZhuozhouZhongtian, 2010-2014
Major Projects of Denox, 2012-2013
Revenue and Net Income of Shandong GEMSKY, 2012
Major Projects of Shandong GEMSKY, 2013-2014
Proportion of China’s Thermal Power Denitration Installed Capacity, 2007-2014
Cumulative Market Share of Major Companies by Total Installed Capacity of Denitration Units, 2013
Capacity of Major SCR Denitration Catalyst Manufacturers in China
Development Course of Desulphurization Industry, 2003-2012
Global and China Synthetic Rubber Industry Report, 2021-2027
Synthetic rubber is a polymer product made of coal, petroleum and natural gas as main raw materials and polymerized with dienes and olefins as monomers, which is typically divided into general synthet...
Global and China Carbon Fiber Industry Report, 2021-2026
Carbon fiber is a kind of inorganic high performance fiber (with carbon content higher than 90%) converted from organic fiber through heat treatment. As a new material with good mechanical properties,...
Global and China Dissolving Pulp Industry Report, 2019-2025
In 2018, global dissolving pulp capacity outstripped 10 million tons and its output surged by 14.0% from a year ago to 7.07 million tons, roughly 70% of the capacity. China, as a key supplier of disso...
Global and China 1, 4-butanediol (BDO) Industry Report, 2019-2025
1,4-butanediol (BDO), an essential organic and fine chemical material, finds wide application in pharmaceuticals, chemicals, textile and household chemicals.
As of the end of 2018, the global BDO cap...
Global and China Carbon Fiber and CFRP Industry Report, 2019-2025
Among the world’s three major high performance fibers, carbon fiber features the highest strength and the highest specific modulus. It is widely used in such fields as aerospace, sports and leisure.
...
Global and China Natural Rubber Industry Report, 2019-2025
In 2018, global natural rubber industry continued remained at low ebb, as a result of economic fundamentals. Global natural rubber price presented a choppy downtrend and repeatedly hit a record low in...
Global and China Ultra High Molecular Weight Polyethylene (UHMWPE) Industry Report, 2019-2025
Ultra high molecular weight polyethylene (UHMWPE), a kind of linear polyethylene with relative molecular weight of above 1.5 million used as an engineering thermoplastic with excellent comprehensive p...
China Polyether Monomer Industry Report, 2019-2025
China has seen real estate boom and issued a raft of policies for continuous efforts in improving weak links in infrastructure sector over the years. Financial funds of RMB1,663.2 billion should be al...
Global and China Viscose Fiber Industry Report, 2019-2025
Over the recent years, the developed countries like the United States, Japan and EU members have withdrawn from the viscose fiber industry due to environmental factor and so forth, while the viscose f...
Global and China Synthetic Rubber (BR, SBR, EPR, IIR, NBR, Butadiene, Styrene, Rubber Additive) Industry Report, 2018-2023
In 2018, China boasted a total synthetic rubber capacity of roughly 6,667kt/a, including 130kt/a new effective capacity. Considering capacity adjustment, China’s capacity of seven synthetic rubbers (B...
Global and China Dissolving Pulp Industry Report, 2018-2022
With the commissioning of new dissolving pulp projects, the global dissolving pulp capacity had been up to about 8,000 kt by the end of 2017. It is worth noticing that the top six producers including ...
Global and China Carbon Fiber and CFRP Industry Report, 2018-2022
As a new generation of reinforced fiber boasting intrinsic properties of carbon material and excellent processability of textile fiber, carbon fiber is the one with the highest specific strength and s...
Global and China Ultra High Molecular Weight Polyethylene (UHMWPE) Industry Report, 2017-2021
Ultra High Molecular Weight Polyethylene (UHMWPE), a kind of linear polyethylene with relative molecular weight of above 1.5 million and an engineering thermoplastic with excellent comprehensive prope...
Global and China Aramid Fiber Industry Report, 2017-2021
Global aramid fiber output totaled 115kt with capacity utilization of 76.0% in 2016. As industries like environmental protection and military develop, the output is expected to rise to 138kt and capac...
Global and China Natural Rubber Industry Report, 2017-2021
In 2016, the global natural rubber output edged up 1.1% year on year to 12.4 million tons, and the consumption rose by 3.8% year on year to 12.6 million tons, indicating the gap of 200,000 tons betwee...
China Synthetic Rubber Industry Report, 2017-2021
Synthetic rubber is one of important strategic materials, mainly used in tyres and other industries. In 2016, the global output and consumption of synthetic rubber reached 14.822 million tons and 14.9...
Global and China 1,4-butanediol (BDO) Industry Report, 2017-2021
1,4-butanediol (BDO) is a key raw material for organic and fine chemicals, capable of generating various derivatives like THF, PTMEG and GBL. BDO and its derivatives find wide application in PBT plast...
Global and China Ethylene Oxide (EO) Industry Report, 2017-2021
Ethylene oxide (EO) is one of the major derivatives of the ethylene industry. Featured with special reactivity, it can generate a series of fine chemical products for a wide range of applications.
In...